
Hello everyone, I have a question that I could not find any CLEAR answer on that, even though I think I have an "intuition" (because I am relatively new in bulk RNA-seq analysis) that just need to be confirmed, hence my post here.
I have run the DESeq2 pipeline on my data according to the official guidelines (link_1, and link_2). Now, I want to plot a heatmap of my genes of interest, but how to do that PROPERLY?
Indeed, usually in heatmaps, the Z-score is plotted, which should be (x - row_average)/row_standard_deviation, right? However, in the guidelines, the code is:
topVarGenes <- head(order(rowVars(assay(vsd)), decreasing = TRUE), 20)
mat  <- assay(vsd)[ topVarGenes, ]
mat  <- mat - rowMeans(mat)
anno <- as.data.frame(colData(vsd)[, c("cell","dex")])
pheatmap(mat, annotation_col = anno)
Here, after data transformation (vst method), the transformed values are only subtracted to the row_average, and not "scaled" by dividing by the row_standard deviation. From what I have understood in forums related to DESeq2, it's because the vst (or rlog) transformations are affecting the variance of the data (since they have been designed for that purpose actually), therefore it is not correct to divide by the row_standard_deviation anymore. Is that right ? I am asking that because of two things:
_ First, in some forums (example here), sometimes people claims that you should "scale" the transformed data (vsd or rlog) in the pheatmap function by using the scale="row" option with mat=assay(vsd)[ topVarGenes, ] (not the matrix with - rowMeans(mat)). Indeed scale="row" performs the (x - row_average)/row_standard_deviation formula, but it is not correct to do after vsd transformation, right ? Instead, it should be more correct to apply that formula on the "normalised counts" that can be retrieved by counts(dds,normalized=TRUE), is that right ? But in that case, why having calculated the vsd data in the first place then? This could be wrong to do too as it will over-amplify the genes with low expression..., right?
_ Second, when I plot heatmaps according to the guidelines, I usually have a heatmap that does not look with strong differences between my 3 conditions. However, when I scale either the vsd_transformed_data or the normalized_counts, I have heatmaps that show way more differences between conditions. Additionally, the dendrogram does not look the same if I scale or not. Plus, sometimes, for the same gene, I have different color contrasts if I scale or not, so I don't know what graph is to trust...
Therefore, I am afraid to use the wrong way of plotting my data, which will ultimately lead to misinterpretation of my data, and I want to do it the proper way! Could you please explain clearly what is correct or incorrect to do for heatmaps after data transformation in DESeq2:
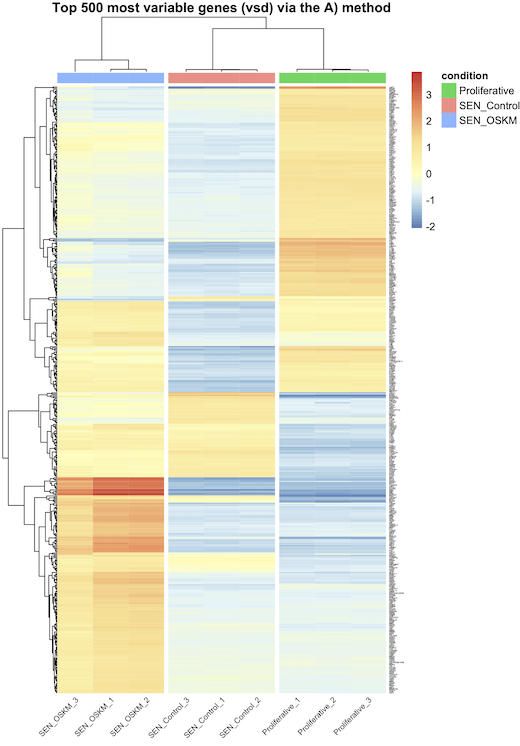
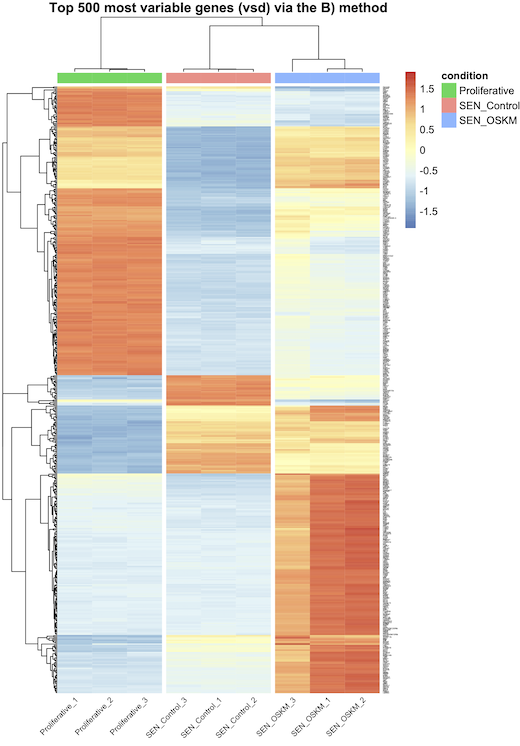
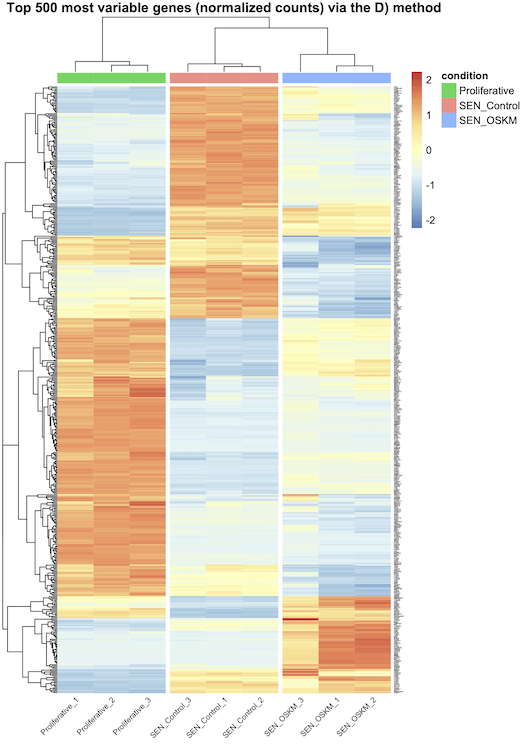
A) vst transformation and row_average subtraction, and that's all ? B) vst tranformation (without row_average subtraction) and scaling in pheatmap with the scale="row" option ? C) vst transformation, row_average subtraction, and scaling in pheatmap with the scale="row" option ? D) normalized counts and scaling in pheatmap with the scale="row" option ?
I think A is correct (and maybe D) ?), but they do not generate the same graphs as I said earlier (see the images attached bellow). Actually, every-time, when I scale (whether using B), C), or D), I see bigger differences between my conditions, but is that because I do the wrong thing ?
Thanks in advance for your response, I really like this package as well as your responses on previous forums that have been very useful to me, thank you for all this work, Best regards,

sessionInfo( )
R version 4.4.0 (2024-04-24)
Platform: x86_64-apple-darwin20
Running under: macOS Monterey 12.7.6

Matrix products: default
BLAS:   /Library/Frameworks/R.framework/Versions/4.4-x86_64/Resources/lib/libRblas.0.dylib
LAPACK: /Library/Frameworks/R.framework/Versions/4.4-x86_64/Resources/lib/libRlapack.dylib;  LAPACK version 3.12.0

locale:
[1] en_US.UTF-8/en_US.UTF-8/en_US.UTF-8/C/en_US.UTF-8/en_US.UTF-8

time zone: Europe/Paris
tzcode source: internal

attached base packages:
[1] stats4    stats     graphics  grDevices utils     datasets  methods
[8] base

other attached packages:
 [1] plyr_1.8.9                  htmlwidgets_1.6.4
 [3] plotly_4.10.4               genefilter_1.86.0
 [5] ashr_2.2-63                 glmpca_0.2.0
 [7] PoiClaClu_1.0.2.1           pheatmap_1.0.12
 [9] dplyr_1.1.4                 vsn_3.72.0
[11] RColorBrewer_1.1-3          BiocManager_1.30.23
[13] patchwork_1.2.0             ggplot2_3.5.1
[15] DESeq2_1.44.0               SummarizedExperiment_1.34.0
[17] Biobase_2.64.0              MatrixGenerics_1.16.0
[19] matrixStats_1.3.0           GenomicRanges_1.56.1
[21] GenomeInfoDb_1.40.1         IRanges_2.38.0
[23] S4Vectors_0.42.0            BiocGenerics_0.50.0

loaded via a namespace (and not attached):
 [1] DBI_1.2.3               rlang_1.1.4             magrittr_2.0.3
 [4] compiler_4.4.0          RSQLite_2.3.7           png_0.1-8
 [7] vctrs_0.6.5             pkgconfig_2.0.3         crayon_1.5.3
[10] fastmap_1.2.0           XVector_0.44.0          labeling_0.4.3
[13] utf8_1.2.4              UCSC.utils_1.0.0        preprocessCore_1.66.0
[16] purrr_1.0.2             bit_4.0.5               zlibbioc_1.50.0
[19] cachem_1.1.0            jsonlite_1.8.8          blob_1.2.4
[22] DelayedArray_0.30.1     BiocParallel_1.38.0     irlba_2.3.5.1
[25] parallel_4.4.0          R6_2.5.1                SQUAREM_2021.1
[28] limma_3.60.3            Rcpp_1.0.12             Matrix_1.7-0
[31] splines_4.4.0           tidyselect_1.2.1        abind_1.4-5
[34] codetools_0.2-20        affy_1.82.0             lattice_0.22-6
[37] tibble_3.2.1            withr_3.0.0             KEGGREST_1.44.1
[40] survival_3.7-0          Biostrings_2.72.1       pillar_1.9.0
[43] affyio_1.74.0           generics_0.1.3          invgamma_1.1
[46] truncnorm_1.0-9         munsell_0.5.1           scales_1.3.0
[49] xtable_1.8-4            glue_1.7.0              lazyeval_0.2.2
[52] tools_4.4.0             hexbin_1.28.3           data.table_1.15.4
[55] annotate_1.82.0         locfit_1.5-9.9          XML_3.99-0.16.1
[58] grid_4.4.0              tidyr_1.3.1             AnnotationDbi_1.66.0
[61] colorspace_2.1-0        GenomeInfoDbData_1.2.12 cli_3.6.3
[64] fansi_1.0.6             mixsqp_0.3-54           S4Arrays_1.4.1
[67] viridisLite_0.4.2       gtable_0.3.5            digest_0.6.36
[70] SparseArray_1.4.8       farver_2.1.2            memoise_2.0.1
[73] htmltools_0.5.8.1       lifecycle_1.0.4         httr_1.4.7
[76] statmod_1.5.0           bit64_4.0.5             MASS_7.3-61
