Hi,
I am having problems with constructing a heatmap for my dds data.
Code should be placed in three backticks as shown below. The codes I am using are given:
```dds1 <- DESeqDataSetFromMatrix(countData = countData, colData = colData, design = ~ genotype + treatment) dds1 <- DESeq(dds1) res1 <- results(dds1) sigs <-sigs(sigs$padj < 0.05) resSig <- res1[ which(res1$padj < 0.05), ] df <-as.data.frame(resSig) df df.top <- df[ which(df$baseMean > 50) & abs(df$log2FoldChange) > 0.5, ] df.top <-df.top[order(df.top$log2FoldChange, decreasing = TRUE), ]'"
this gives me the genes with absolute 2logfoldchange >0.5 and filters out genes with less than 50 basemean. then i log normalize the dds data. "'rlog_out <- rlog( dds1, blind = FALSE)"'
"'mat <-assay(rlog_out)[row.names(df.top), rownames(colData)]"'
when i run the above code to convert my normalized data to matrix format I am presented with this error
Error in assay(rlog_out)[rownames(df.top), rownames(colData)] : subscript out of bounds.
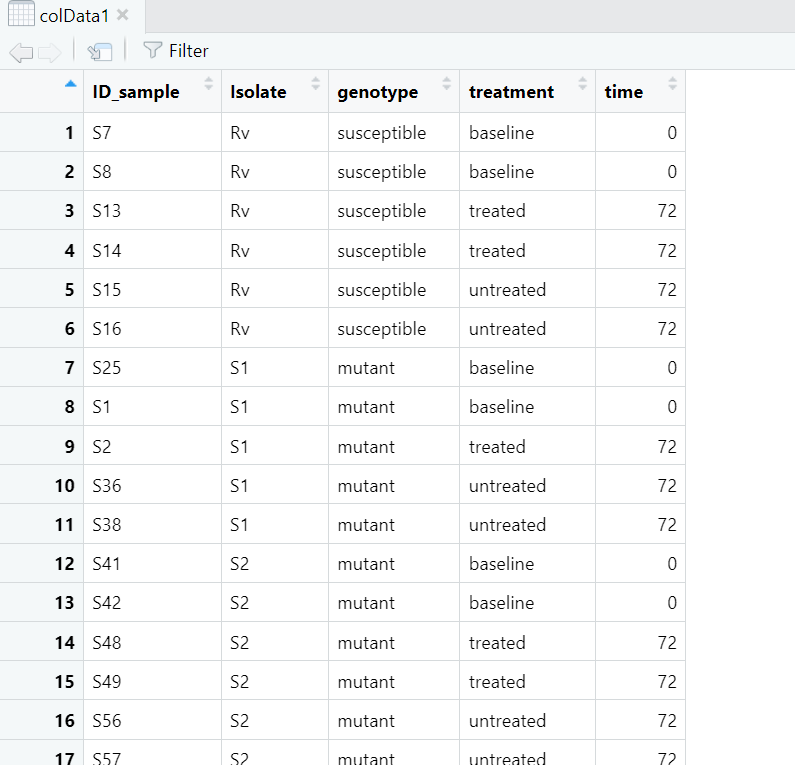
i suspect this has to do with the colData and the normalized data. What I gathered from the tutorials was that the colData should have the isolates ID and not serial row numbers as I am observing for my colData, shared below:
""rownames (colData1)"' 1 "1" "2" "3" "4" "5" "6" "7" "8" "9" "10" "11" "12" "13" [14] "14" "15" "16" "17" "18" "19" "20" "21" "22" "23" "24" "25" "26" [27] "27" "28" "29" "30" "31" "32" "33" "34" "35" "36" "37" "38" "39" [40] "40" "41" "42" "43" "44" "45" "46" "47" "48" "49" "50" "51" "52" [53] "53" "54" "55" "56" "57"
"'view (colData)"'
I am also confused about the rlogtransformed data. When I ran the code "'assay(rlog)"' got the following: [1,] 11.7475488 [2,] 11.1782859 [3,] 9.7768088 [4,] 8.3933343 [5,] 6.2142404 [6,] 9.3677442 [7,] 11.3905586 [8,] 10.9357319 [9,] 11.5100845 [10,] 9.4760910 [11,] 10.5400167 [12,] 10.7315200 [13,] 9.9845541 [14,] 10.4433000 [15,] 8.4034379 [16,] 10.0455839 [17,] 9.3174048 ..... [996,] 12.0555727 [997,] 6.8798300 [998,] 9.5517827 [999,] 7.7968484 [1000,] 12.0714825 [ reached getOption("max.print") -- omitted 2978 rows ]
rlog_out class: DESeqTransform dim: 3978 57 metadata(1): version assays(1): '' rownames(3978): Rv0001 Rv0897c ... Rv0895 Rv0896 rowData names(36): baseMean baseVar ... dispFit rlogIntercept colnames(57): S7 S8 ... S10_61 S10_63 colData names(7): ID_sample Isolate ... sizeFactor replaceable
GRanges object with 0 ranges and 0 metadata columns: seqnames ranges strand
<Rle> <IRanges> <Rle>
seqinfo: no sequences
...
<3975 more elements>> > rlog_out@assays
An object of class "SimpleAssays" Slot "data": List of length 1
rlog_out@elementMetadata DataFrame with 3978 rows and 0 columns
vsd@rowRanges GRangesList object of length 3978: $Rv0001 GRanges object with 0 ranges and 0 metadata columns: seqnames ranges strand
<Rle> <IRanges> <Rle>
seqinfo: no sequences
$Rv0897c GRanges object with 0 ranges and 0 metadata columns: seqnames ranges strand
<Rle> <IRanges> <Rle>
seqinfo: no sequences
$Rv0898c GRanges object with 0 ranges and 0 metadata columns: seqnames ranges strand
<Rle> <IRanges> <Rle>
seqinfo: no sequences
...
<3975 more elements>vsd@elementMetadata DataFrame with 3978 rows and 0 columns vsd@metadata $version 1 '1.40.1'
include your problematic code here with any corresponding output
Error in assay(rlog_out)[rownames(df.top), rownames(colData)] : subscript out of bounds.
please also include the results of running the following in an R session
sessionInfo( ) R version 4.3.0 (2023-04-21 ucrt) Platform: x86_64-w64-mingw32/x64 (64-bit) Running under: Windows 11 x64 (build 22000)
Matrix products: default
attached base packages: 1 stats4 stats graphics grDevices utils datasets [7] methods base
other attached packages:
1 pheatmap_1.0.12 DESeq2_1.40.1
[3] SummarizedExperiment_1.30.2 Biobase_2.60.0
[5] MatrixGenerics_1.12.2 matrixStats_1.0.0
[7] GenomicRanges_1.52.0 GenomeInfoDb_1.36.0
[9] IRanges_2.34.0 S4Vectors_0.38.1
[11] BiocGenerics_0.46.0 lubridate_1.9.2
[13] forcats_1.0.0 stringr_1.5.0
[15] purrr_1.0.1 readr_2.1.4
[17] tidyr_1.3.0 tibble_3.2.1
[19] ggplot2_3.4.2 tidyverse_2.0.0
[21] dplyr_1.1.2
loaded via a namespace (and not attached):
1 tidyselect_1.2.0 farver_2.1.1
[3] bitops_1.0-7 fastmap_1.1.1
[5] RCurl_1.98-1.12 promises_1.2.0.1
[7] digest_0.6.31 timechange_0.2.0
[9] mime_0.12 lifecycle_1.0.3
[11] ellipsis_0.3.2 processx_3.8.1
[13] magrittr_2.0.3 compiler_4.3.0
[15] rlang_1.1.1 tools_4.3.0
[17] utf8_1.2.3 htmlwidgets_1.6.2
[19] prettyunits_1.1.1 S4Arrays_1.0.4
[21] curl_5.0.1 pkgbuild_1.4.1
[23] DelayedArray_0.26.3 RColorBrewer_1.1-3
[25] pkgload_1.3.2 BiocParallel_1.34.2
[27] miniUI_0.1.1.1 withr_2.5.0
[29] desc_1.4.2 grid_4.3.0
[31] fansi_1.0.4 urlchecker_1.0.1
[33] profvis_0.3.8 xtable_1.8-4
[35] colorspace_2.1-0 scales_1.2.1
[37] cli_3.6.1 crayon_1.5.2
[39] remotes_2.4.2 generics_0.1.3
[41] rstudioapi_0.14 tzdb_0.4.0
[43] sessioninfo_1.2.2 cachem_1.0.8
[45] zlibbioc_1.46.0 parallel_4.3.0
[47] XVector_0.40.0 vctrs_0.6.3
[49] devtools_2.4.5 Matrix_1.5-4
[51] callr_3.7.3 hms_1.1.3
[53] locfit_1.5-9.8 glue_1.6.2
[55] codetools_0.2-19 ps_1.7.5
[57] stringi_1.7.12 gtable_0.3.3
[59] later_1.3.1 munsell_0.5.0
[61] pillar_1.9.0 htmltools_0.5.5
[63] GenomeInfoDbData_1.2.10 R6_2.5.1
[65] rprojroot_2.0.3 shiny_1.7.4
[67] lattice_0.21-8 memoise_2.0.1
[69] httpuv_1.6.11 Rcpp_1.0.10
[71] usethis_2.2.0 fs_1.6.2
[73] pkgconfig_2.0.3


