Please note that it is not correct that all genes that belong to a certain category are plotted. I agree that it is not explicitly mentioned at the help page of the cnetplot function, but if you check chapter 15.3 of the clusterProfiler book you will read "GSEA result is also supported with only core enriched genes displayed." Since you performed a GSEA analysis, only the core enriched genes are plotted. Core enriched genes = leading edge genes in GSEA terminology.
Below some code to confirm that only the core enriched genes are plotted, and not all genes belonging to a category:
> library(clusterProfiler)
>
> ## for reproducibility, use the provided example dataset
> data(geneList, package = "DOSE")
>
> ## perform GSEA using GO-BP categories
> ## note that you used **very relaxed criteria** for min and max size!
> gse <- gseGO(gene = geneList,
+ ont ="BP",
+ eps = 0,
+ minGSSize = 3,
+ maxGSSize = 1000,
+ pvalueCutoff = 0.05,
+ verbose = TRUE,
+ OrgDb = "org.Hs.eg.db",
+ pAdjustMethod = "none")
preparing geneSet collections...
GSEA analysis...
leading edge analysis...
done...
>
> ## check
> gse
#
# Gene Set Enrichment Analysis
#
#...@organism Homo sapiens
#...@setType BP
#...@keytype ENTREZID
#...@geneList Named num [1:12495] 4.57 4.51 4.42 4.14 3.88 ...
- attr(*, "names")= chr [1:12495] "4312" "8318" "10874" "55143" ...
#...nPerm
#...pvalues adjusted by 'none' with cutoff <0.05
#...1910 enriched terms found
'data.frame': 1910 obs. of 11 variables:
$ ID : chr "GO:0051276" "GO:0000278" "GO:1903047" "GO:0007059" ...
$ Description : chr "chromosome organization" "mitotic cell cycle" "mitotic cell cycle process" "chromosome segregation" ...
$ setSize : int 455 744 617 278 188 165 233 357 942 391 ...
$ enrichmentScore: num 0.524 0.443 0.467 0.57 0.646 ...
$ NES : num 2.56 2.25 2.34 2.65 2.87 ...
$ pvalue : num 9.72e-31 1.36e-28 2.78e-28 2.09e-25 2.61e-25 ...
$ p.adjust : num 9.72e-31 1.36e-28 2.78e-28 2.09e-25 2.61e-25 ...
$ qvalue : num 8.79e-27 6.14e-25 8.37e-25 4.71e-22 4.72e-22 ...
$ rank : num 1374 1264 1257 1374 532 ...
$ leading_edge : chr "tags=24%, list=11%, signal=22%" "tags=21%, list=10%, signal=20%" "tags=22%, list=10%, signal=21%" "tags=26%, list=11%, signal=24%" ...
$ core_enrichment: chr "8318/55143/991/9493/1062/10403/7153/23397/9787/11065/55355/51203/10460/4751/55839/983/54821/4085/9837/81930/816"| __truncated__ "8318/55143/991/2305/9493/1062/4605/9833/9133/10403/23397/79733/6241/55165/9787/11065/220134/55872/51203/22974/1"| __truncated__ "8318/55143/991/2305/9493/1062/4605/9833/9133/10403/23397/6241/55165/9787/11065/55872/51203/22974/10460/4751/273"| __truncated__ "55143/991/9493/1062/10403/7153/23397/9787/11065/55355/220134/51203/10460/4751/55839/4085/81930/81620/332/3832/7"| __truncated__ ...
#...Citation
T Wu, E Hu, S Xu, M Chen, P Guo, Z Dai, T Feng, L Zhou, W Tang, L Zhan, X Fu, S Liu, X Bo, and G Yu.
clusterProfiler 4.0: A universal enrichment tool for interpreting omics data.
The Innovation. 2021, 2(3):100141
>
> ## what are the 2 most significantly enriched gene sets?
> as.data.frame(gse)[1:2,]
ID Description setSize enrichmentScore NES
GO:0051276 GO:0051276 chromosome organization 455 0.5235628 2.557910
GO:0000278 GO:0000278 mitotic cell cycle 744 0.4429047 2.248928
pvalue p.adjust qvalue rank
GO:0051276 9.720836e-31 9.720836e-31 8.789683e-27 1374
GO:0000278 1.357929e-28 1.357929e-28 6.139269e-25 1264
leading_edge
GO:0051276 tags=24%, list=11%, signal=22%
GO:0000278 tags=21%, list=10%, signal=20%
core_enrichment
GO:0051276 8318/55143/991/9493/1062/10403/7153/23397/9787/11065/55355/51203/10460/4751/55839/983/54821/4085/9837/81930/81620/332/3832/2146/7272/64151/9212/51659/9319/9055/3833/146909/891/24137/4174/9232/4171/9928/11004/990/5347/29127/26255/701/9156/11130/57405/10615/3159/79075/2491/8438/9700/5888/898/3149/11339/3070/9134/4175/4173/2237/22948/5984/9918/1058/84296/699/4609/1063/5111/64785/9401/26271/55055/641/1763/54892/8357/3024/4176/3148/79980/3006/4436/5982/9735/908/23310/8607/3008/10051/10576/3009/4172/9631/83990/5885/2072/84722/51115/7283/5983/4678/5588/54908/10592/51377/4683/54069
GO:0000278 8318/55143/991/2305/9493/1062/4605/9833/9133/10403/23397/79733/6241/55165/9787/11065/220134/55872/51203/22974/10460/4751/27338/890/983/4085/9837/5080/81930/81620/332/3832/2146/7272/64151/9212/1111/9319/9055/3833/146909/10112/51514/6790/891/24137/9232/4171/1033/9928/1164/11004/993/4603/57348/990/5347/29127/26255/701/51512/11130/1978/57405/10615/1894/79075/9700/5888/898/56992/4998/4288/10733/339479/1163/9134/4175/4173/29899/10926/54962/6502/440/994/6347/9918/29980/1058/699/4609/6491/1063/5111/64785/26271/55055/51053/641/1869/1029/1763/3925/54892/55159/8317/7277/5902/2296/79980/9585/4436/9735/5641/586/5721/10950/23310/1871/1031/2253/79915/11169/55726/8877/80086/9088/995/10051/1104/84790/1019/284403/637/4172/79866/5885/80124/11200/11040/10263/9032/203068/7027/2290/940/1761/23175/84722/6873/51115/7283/8883/10381
>
> ## extract the (number of) core enriched genes of each GO category,
> ## as well as the total number of genes that make up a GO category.
> ## note that these numbers are not identical!
>
> library(stringr)
> core.genes <- str_split(as.data.frame(gse)[,"core_enrichment"] , "/")
> nmbr.core.genes <- lengths(core.genes)
>
> head( cbind( as.data.frame(gse)[ ,c("Description", "setSize")] , nmbr.core.genes) )
Description setSize nmbr.core.genes
GO:0051276 chromosome organization 455 110
GO:0000278 mitotic cell cycle 744 154
GO:1903047 mitotic cell cycle process 617 135
GO:0007059 chromosome segregation 278 73
GO:0000819 sister chromatid segregation 188 46
GO:0000070 mitotic sister chromatid segregation 165 44
>
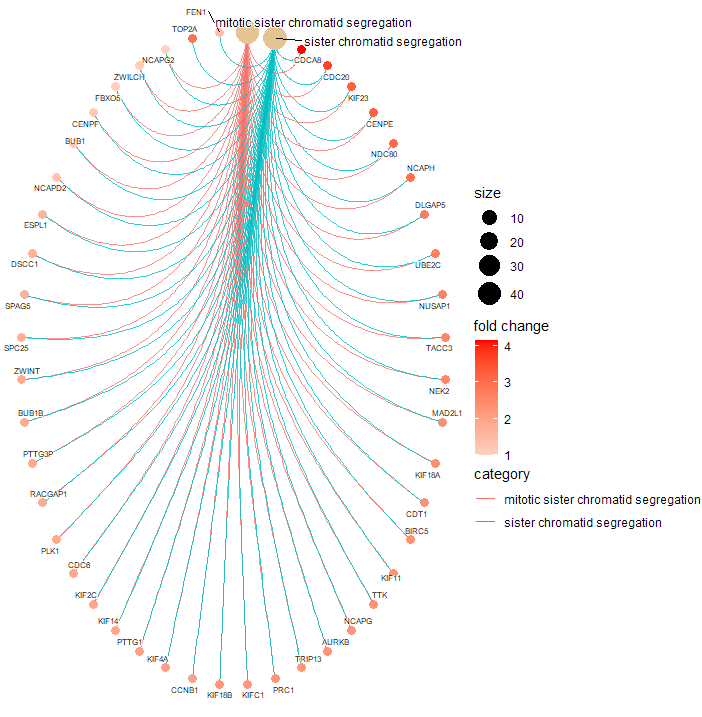
> ## Visualize the default, unfiltered results in a cnetplot
>
> ## first convert gene ID to Symbol
> gse.orig <- setReadable(gse, 'org.Hs.eg.db', 'ENTREZID')
>
> ## use new way of specifying visualization options
> color.params = list(foldChange = geneList, edge = TRUE)
> cex.params = list(category_label = 0.6, gene_label = 0.4)
>
> cnetplot(gse.orig,
+ showCategory = c("mitotic sister chromatid segregation",
+ "sister chromatid segregation"),
+ circular = TRUE,
+ color.params = color.params,
+ cex.params = cex.params)
Scale for size is already present.
Adding another scale for size, which will replace the existing scale.
>


It appears you would like to check for GO-BP categories that are enriched in you list of DEG (734 genes). You should therefore rather use the
enrichGOfunction, and not thegseGOfunction! The latter performs a gene set enrichment analysis (GSEA), and for that the whole dataset is required in which genes are ranked by a metric (e.g. signed p-value or log2(fold change)). See e.g. here for more info on the differences between the 2 methods (chapter 5.2 and 5.3).