Hi everybody,
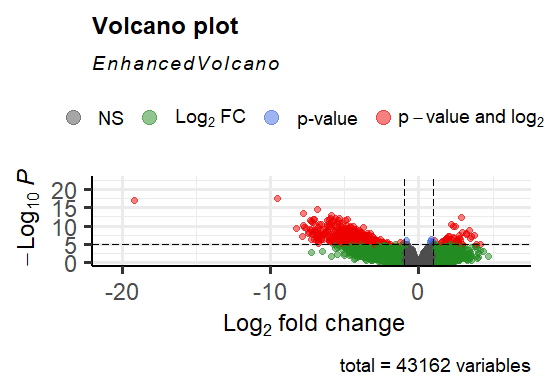
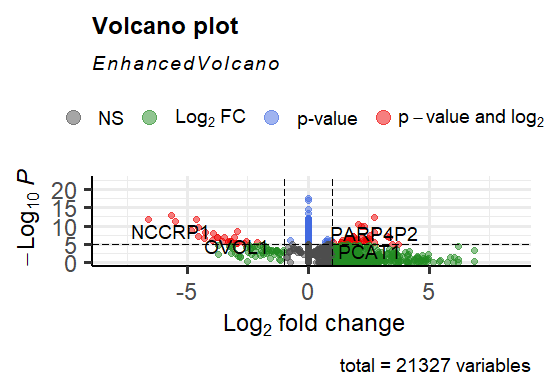
I performed a DeSeq2 analysis and after I performed the lfcshrinkage command, I obtained very small log2fold changes for some of my results. As a consequence, my enhanced volcano plot looks very weird. These are the values for the results before I performed lfcshrinkage:
Gene log2fold change ENSG00000184330 -9.582811812
ENSG00000244057 -19.21921435
ENSG00000166535 -6.860621849
ENSG00000105388 -7.784157629
ENSG00000188505 -5.89005343
These are the outputs after I performed the lfc shrinkage command:
ENSG00000184330-9.79E-06
ENSG00000244057 -3.39E-07
ENSG00000166535 -2.13E-05
ENSG00000105388 -1.90E-06
ENSG00000188505 -5.646991067
As well, I have attached the two volcano plots: The first one is performed before lfcshrinkage and the 2nd plot contains the results after lfcshrinkage was performed
Has anybody obtained similiar results like this?
Thank you very much for any help.


Thank you very much Michael for the quick answer.
My only concern was does it make sense, that the lower plot has this huge bar in the middle or can that happen due to the LFCshrinkage?
Best wishes,
Nico
Yes that makes sense. Those are genes where, according to the LFC shrinkage, there is not evidence of an LFC != 0. You might want to investigate some of these by eye with plotCounts.
Hi Michael,
thank you very much for your answer. I performed plotcounts and I still have a question: I attached 2 plotcounts. One with a "normal" FC and one that has a super small FC (-3.4E-07). My question is:Why is the LFC=0 for the system for that gene, because some counts are pretty high for the negative group.
The LFC for the second one is hard to define because you have bimodal data that is not consistent with a NB distribution. You have a large majority of samples with 0 and then some with very large counts.
In the apeglm paper we also implement apeglm for ZINB data, where you get posterior estimates of LFC for the positive part of the distribution.
But then here you would have group=neg with some samples with positive count, and group=pos with no samples with positive count, so the LFC is hard to define. But the shrunken LFC in that case (if you use the ZINB pipeline) should be non-zero.
If you are interested there is code on how to combine ZINB with apeglm. I'll update it and post a comment.
OK thank you. Yes if you could provide the code that would be great.
Sure, here is code for running zinbwave + apeglm, I just checked to make sure it works with recent release of Bioc:
https://github.com/mikelove/zinbwave-apeglm