Entering edit mode
Graeme Thorn
▴
10
@graeme-thorn-8013
Last seen 4.5 years ago
Barts Cancer Institute, QMUL, London, UK
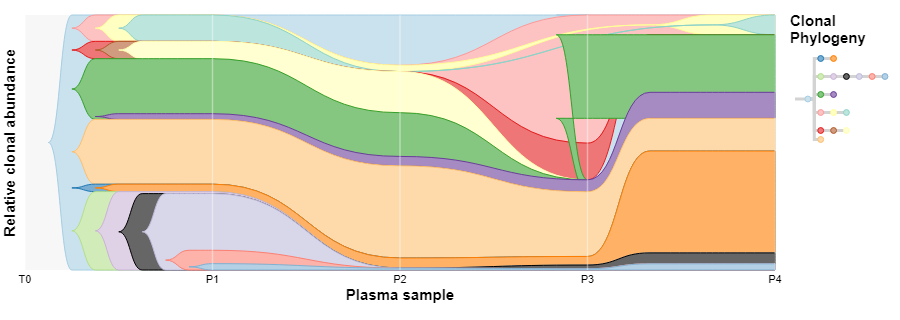
I'm trying to use timescape to generate clonal evolution diagrams from the output of CALDER: https://github.com/raphael-group/calder, and most of the results are fine, but for some of them the output of timescape is odd (see for instance the green clone around the timepoint P3, and the cyan subclone of pale yellow, which appears outside its parent at the same time point):

The two files that timescape uses (the prev and the edges files) I can provide if required
The code I run to generate this plot is a function (as I repeat it on multiple output files):
generate_timescape <- function(sampleid="Patient A",...){
  prev <- read.table(paste0(sampleid,"_prev.txt"),header=TRUE)
  edges <- read.table(paste0(sampleid,"_edges.txt"),header=TRUE)
  timescape (clonal_prev =prev, tree_edges = edges,clone_colours = clone.cols,
    xaxis_title="Plasma sample",yaxis_title="Relative clonal abundance",alpha=40,...)
}

sessionInfo( ):
R version 4.0.3 (2020-10-10)
Platform: x86_64-w64-mingw32/x64 (64-bit)
Running under: Windows 10 x64 (build 19041)

Matrix products: default

locale:
[1] LC_COLLATE=English_United Kingdom.1252  LC_CTYPE=English_United Kingdom.1252
[3] LC_MONETARY=English_United Kingdom.1252 LC_NUMERIC=C
[5] LC_TIME=English_United Kingdom.1252

attached base packages:
[1] stats     graphics  grDevices utils     datasets  methods   base

other attached packages:
[1] RColorBrewer_1.1-2 timescape_1.12.0

loaded via a namespace (and not attached):
 [1] htmlwidgets_1.5.2 compiler_4.0.3    magrittr_1.5      htmltools_0.5.0   tools_4.0.3
 [6] yaml_2.2.1        tinytex_0.26      stringi_1.5.3     digest_0.6.25     jsonlite_1.7.1
[11] stringr_1.4.0     xfun_0.18         rlang_0.4.8

