
Hi everyone,
We analysed gene expression in 2 neighbouring tissues (VENTRAL and DORSAL) from 2 independent individuals: 3 cell populations were sorted from each tissue followed by bulk RNAseq: TISSUE 1. Individual 1: END1, DP1, CD451 and Individual 2: END2, DP2, CD452 TISSUE 2. Individual 1: END1, DP1, CD451 and Individual 2: END2, DP2, CD452
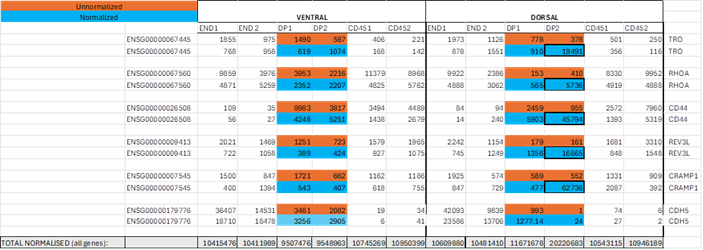
The dataset was normalised but showed enormous discrepancies with unnormalized reads for some (but not all) genes in population DP2 (for simplicity, selection of 5 genes which showed this abnormality shown below). Nothing like that is seen by eye in other columns. We noticed that total reads for all genes after normalisation for DP2 was 2-fold higher than for DP1, whereas total reads for each other cell population in individuals 1 and 2 were similar (shown at the bottom of Table).
I would be grateful if you could suggest what might cause the problem, if indeed it is a problem.
meta <- structure(list(rowname = c("V_VC_1", "V_VC_CD45_1", "D_VC_1",
"D_VC_CD45_1", "V_CD45_1", "D_CD45_1", "V_VC_2", "V_VC_CD45_2",
"V_CD45_2", "D_VC_2", "D_VC_CD45_2", "D_CD45_2"), rep = c("1",
"1", "1", "1", "1", "1", "2", "2", "2", "2", "2", "2"), group = c("V_VC",
"V_VC_CD45", "D_VC", "D_VC_CD45", "V_CD45", "D_CD45", "V_VC",
"V_VC_CD45", "V_CD45", "D_VC", "D_VC_CD45", "D_CD45")), row.names = c(NA,
-12L), class = "data.frame")

dds <- DESeqDataSetFromTximport(txi, colData = meta,
                                             design = ~Rep + Group,
                                             rowData = rowdata)

keep <- filterByExpr(dds, group = dds$Group)
dds <- dds[keep,]

dds <- estimateSizeFactors(dds)

deseq <- DESeq(dds)

counts <- counts(dds, normalized = TRUE)
unnorm_counts <- counts(dds, normalized = FALSE)
Thank you in advance
Please show examples using
plotCounts(). Custom spreadsheets harbor the risk of parsing errors along the way which very often explains what users think is a software error. Per sample all counts are scaled by the same size factor so I strongly assume that something was parsed here incorrectly.Thank you for your reply
Here are the count plots for one example CD44:
normalised:
unnormalised: