
We have performed RNAseq on a lot of samples of individual flies (~ 20 per condition). After running DESeq and then checking various contrasts (with ihw=TRUE), I find myself with quite a bit of genes that are detected as differentially expressed between 2 conditions. But when I plot their counts, I notice that for a lot of them, it comes from the fact that most individuals have 0 counts while 1 or 2 have a high counts, which ends up being responsible for the significance of the Wald test.
I have read that pre-filtering was recommended, something along the lines of
keep <- rowSums(counts(dds) >= x) >= y
However if you look at the example I am joining to this post 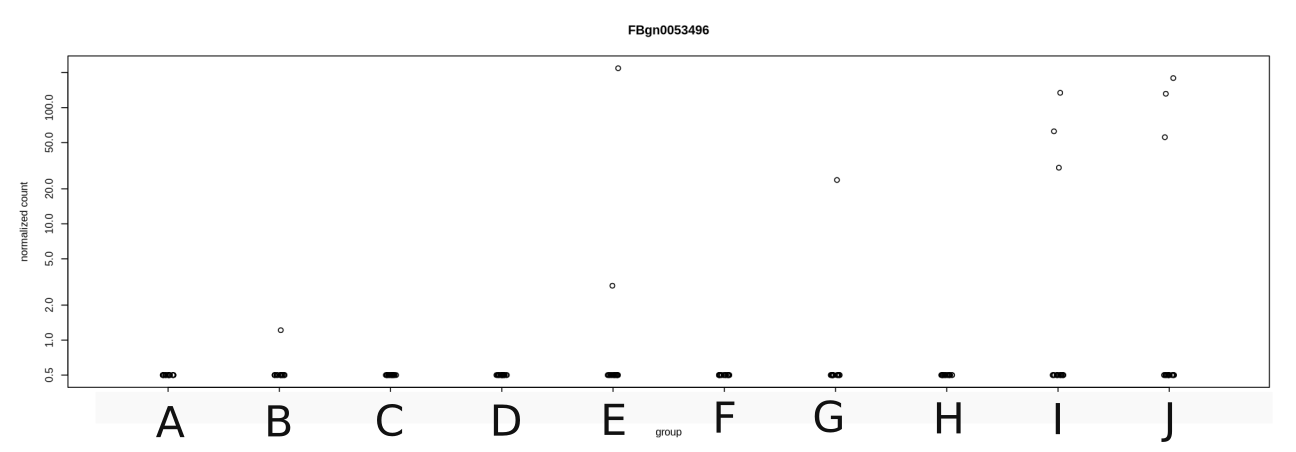
What could I do ?
Thank you !
The problem is that your prefilter is not group-aware so the behaviour of seeing these sorts of outliers is expected. This is why I always recommend
filterByExprfrom edgeR (returning a vector of genes to keep which you can apply to your DESeqDataSet) as this does group-aware filtering, thereby ensuring that retained genes have sufficiently large counts to facilitate a groupwise comparison avoiding the sitatuon you see.I am going to try this right now, thanks !
... I did it. It does filter out quite a bit of genes :
However, when I looked at one specific contrast of my filtered dataset,
there are more genes that are significantly differentially expressed compared to what was the case in my un-filtered dataset (16 genes vs. 10). By plotting counts for all treatment levels for these genes, I notice that 6 genes seem to have the exact same expression pattern, plus the value of the stat is the exact same for all of them. Moreover, when I plot the counts for these genes, there is a gene that is only expressed in only 2 individuals, whereas all other individuals have 0 counts. This gene was not detected as significantly differentially expressed in my non filtered dataset.
I guess I am doing something wrong ?