
Hi all,
I found weird behavior in deseq2 recently.
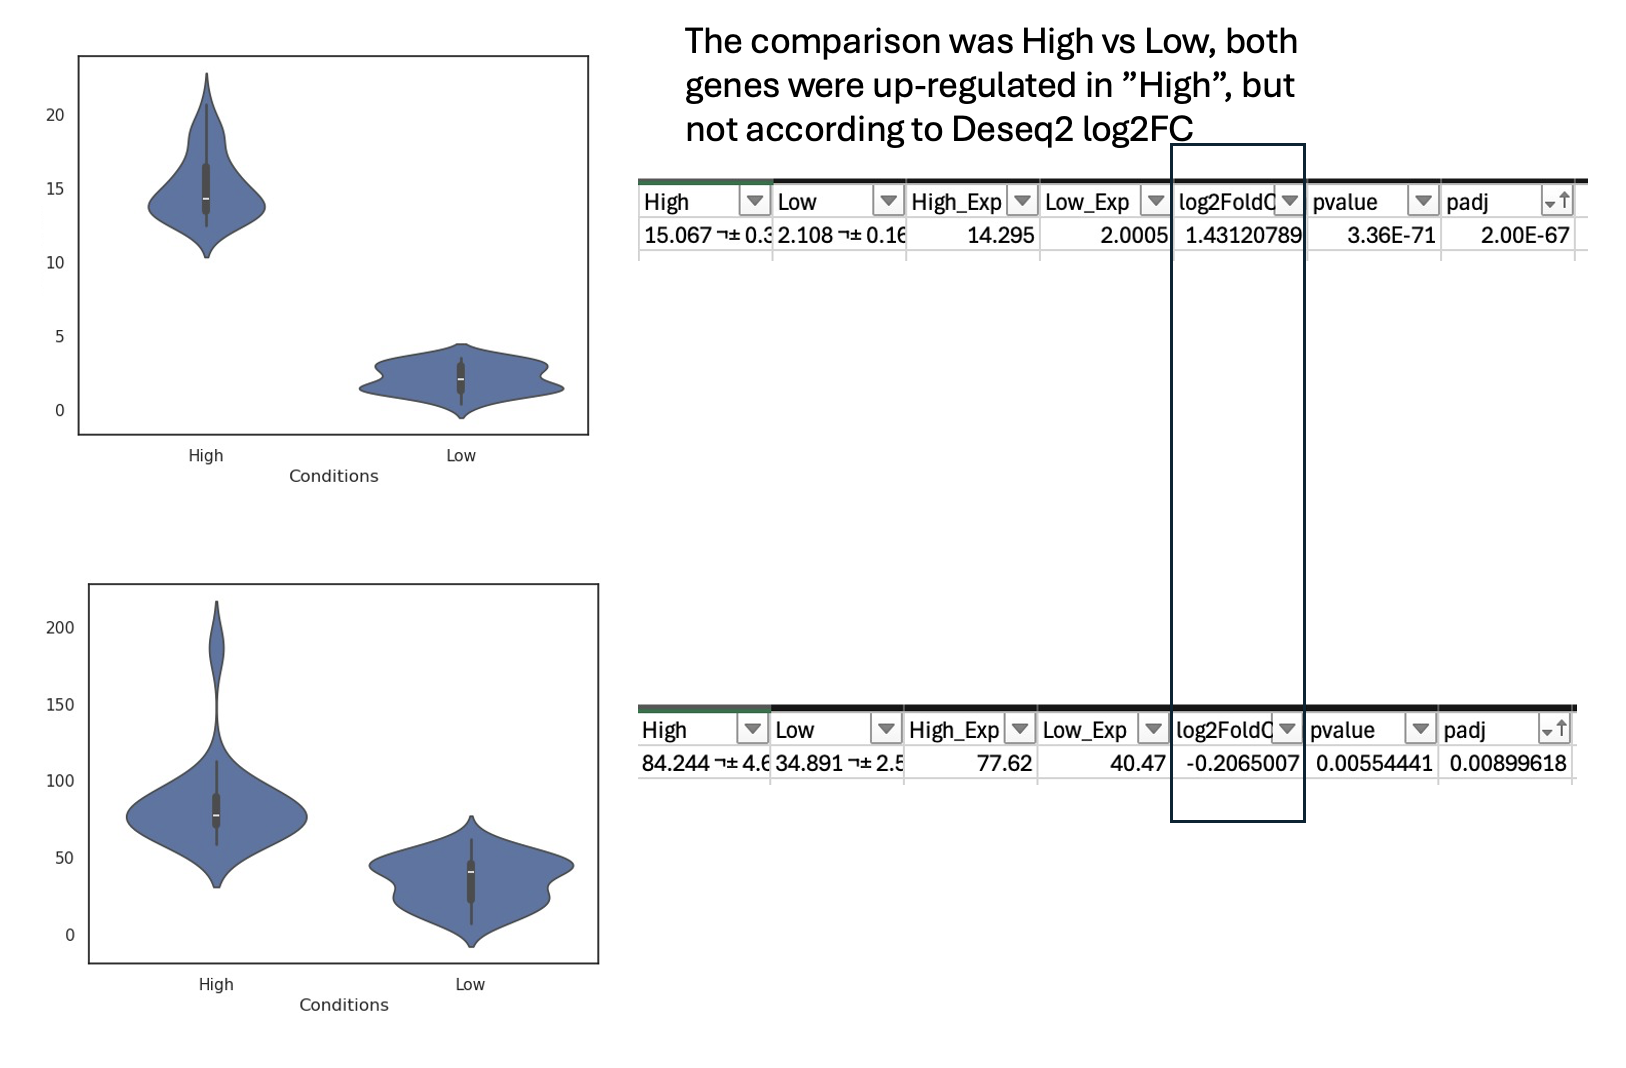
I am conducting an RNA-seq differential expression analysis comparing "High" versus "Low" groups, each consisting of approximately 70 samples. I observed that some genes display unexpected directionalities during the analysis based on their log2 fold change (L2FC) values. See example genes below.
I found that at least 20% of the differentially expressed genes (DEGs) with FDR < 0.05 exhibit this issue. This proportion increases when considering all genes, but even when focusing only on relatively abundant genes (median TPM > 5), the problem persists.
Please advise, perhaps I am doing something wrong.
Thank you!
Note: This issue is pretty isolated in a few datasets I am working on. I have yet to find a pattern, other than that the "problematic" datasets are (1) larger sample size and (2) population-based data, although pretty well characterized (based on the PCA). On the other hand, not all large population-based datasets experienced this issue.
coldata <- as.data.frame(t(as.data.frame(conds)))
rownames(coldata) = subject
colnames(coldata) = conds_col
dds <- DESeqDataSetFromMatrix(countData=as.matrix(count),colData=coldata,design=~Conditions)
dds <- DESeq(dds)
res=results(dds,contrast=c('Conditions',"High","Low"))

sessionInfo( )

R version 4.4.1 (2024-06-14)
Platform: x86_64-suse-linux-gnu
Running under: SUSE Linux Enterprise Server 15 SP5

Matrix products: default
BLAS/LAPACK: /opt/cray/pe/libsci/23.12.5/GNU/12.3/x86_64/lib/libsci_gnu_123_mp.so.6.0;  LAPACK version 3.10.1

locale:
 [1] LC_CTYPE=en_US.UTF-8       LC_NUMERIC=C
 [3] LC_TIME=en_US.UTF-8        LC_COLLATE=en_US.UTF-8
 [5] LC_MONETARY=en_US.UTF-8    LC_MESSAGES=en_US.UTF-8
 [7] LC_PAPER=en_US.UTF-8       LC_NAME=C
 [9] LC_ADDRESS=C               LC_TELEPHONE=C
[11] LC_MEASUREMENT=en_US.UTF-8 LC_IDENTIFICATION=C

time zone: Europe/Stockholm
tzcode source: system (glibc)

attached base packages:
[1] stats4    stats     graphics  grDevices utils     datasets  methods
[8] base

other attached packages:
 [1] DESeq2_1.46.0               SummarizedExperiment_1.36.0
 [3] Biobase_2.66.0              MatrixGenerics_1.18.1
 [5] matrixStats_1.5.0           GenomicRanges_1.58.0
 [7] GenomeInfoDb_1.42.3         IRanges_2.40.1
 [9] S4Vectors_0.44.0            BiocGenerics_0.52.0

loaded via a namespace (and not attached):
 [1] generics_0.1.3          utf8_1.2.4              SparseArray_1.6.1
 [4] lattice_0.22-6          digest_0.6.37           magrittr_2.0.3
 [7] evaluate_1.0.1          grid_4.4.1              pbdZMQ_0.3-13
[10] fastmap_1.2.0           jsonlite_1.8.9          Matrix_1.7-1
[13] httr_1.4.7              fansi_1.0.6             UCSC.utils_1.2.0
[16] scales_1.3.0            codetools_0.2-20        abind_1.4-8
[19] cli_3.6.3               rlang_1.1.4             crayon_1.5.3
[22] XVector_0.46.0          munsell_0.5.1           base64enc_0.1-3
[25] repr_1.1.7              DelayedArray_0.32.0     S4Arrays_1.6.0
[28] tools_4.4.1             parallel_4.4.1          uuid_1.2-1
[31] BiocParallel_1.40.0     dplyr_1.1.4             colorspace_2.1-1
[34] ggplot2_3.5.1           locfit_1.5-9.10         GenomeInfoDbData_1.2.13
[37] IRdisplay_1.1           vctrs_0.6.5             R6_2.5.1
[40] lifecycle_1.0.4         zlibbioc_1.52.0         pkgconfig_2.0.3
[43] pillar_1.9.0            gtable_0.3.6            glue_1.8.0
[46] Rcpp_1.0.13-1           tidyselect_1.2.1        tibble_3.2.1
[49] IRkernel_1.3.2.9000     htmltools_0.5.8.1       compiler_4.4.1

This cannot be answered here like this. Your results tables are not direct DESeq2 output, maybe it's a merging error during generation of these Excel files, maybe your plotting script has issues. It's hard to reproduce. Usually, from what I've seen over these years these "unexpected logFCs" come down to user issues. For help, please try to make it more reproducible. For example, showing the
results()output for these genes directly, and usingplotCounts()for the viz, to ensure there is no user issue in between.Okay, I'm attaching those now. Just to provide a bit more context for the results below: I downloaded both count and TPM data from the GTEx Portal (phs000424.v8.p2), selected one tissue type, and performed some filtering and re-stratification of the individuals. The count and TPM values themselves are unmodified, I only created my grouping of subjects. I can share the count data, TPM values, and metadata I used if needed (all are open access from the GTEx Portal).
As for the results, UBE3A is an example of a gene with consistent results (I double-checked it using TPM values), whereas WDR33 and RHOT2 show inconsistencies when compared to the TPM trends. All of these analyses were conducted in the same environment, as described above.
I've now noticed that the normalized counts from DESeq2 show different trends compared to the TPM values. I understand that deseq2 is performing internal normalization by using size factor (CMIIW). The issue I'm facing now is that I often complemented DESeq2 results with multiple other analyses based on the TPM values, such as correlation analysis, network generation, predictive modeling, etc.
I am open to suggestions.