
Hi everyone,
I am analysing an RNAseq dataset where despite the count data showing differences between groups of interest (and not much within group), a gene is not being flagged as differentially expressed. I would like to understand why this is and what I can do!
The coldata is as follows:
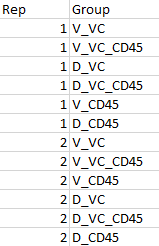
My code for finding DE genes between groups while controlling for replicates is as follows:
dds <- DESeqDataSetFromTximport(txi, colData = meta,
                                             design = ~Rep + Group,
                                             rowData = rowdata)

keep <- filterByExpr(dds, group = dds$Group)
dds <- dds[keep,]

dds <- estimateSizeFactors(dds)

deseq <- DESeq(dds)

res <- results(deseq, contrast = c("Group", "V_VC", "V_VC_CD45"), alpha = 0.05, tidy = TRUE)

sessionInfo( )
R version 4.4.2 (2024-10-31 ucrt)
Platform: x86_64-w64-mingw32/x64
Running under: Windows 11 x64 (build 22631)

Matrix products: default


locale:
[1] LC_COLLATE=English_United Kingdom.utf8  LC_CTYPE=English_United Kingdom.utf8    LC_MONETARY=English_United Kingdom.utf8
[4] LC_NUMERIC=C                            LC_TIME=English_United Kingdom.utf8

time zone: Europe/London
tzcode source: internal

attached base packages:
[1] stats4    stats     graphics  grDevices datasets  utils     methods   base

other attached packages:
 [1] ashr_2.2-63                 edgeR_4.4.2                 limma_3.62.2                tximport_1.34.0             biomaRt_2.62.1
 [6] pheatmap_1.0.12             DESeq2_1.46.0               SummarizedExperiment_1.36.0 Biobase_2.66.0              MatrixGenerics_1.18.1
[11] matrixStats_1.5.0           GenomicRanges_1.58.0        GenomeInfoDb_1.42.3         IRanges_2.40.1              S4Vectors_0.44.0
[16] BiocGenerics_0.52.0         here_1.0.1                  tibble_3.2.1                readr_2.1.5                 openxlsx_4.2.8
[21] dplyr_1.1.4

loaded via a namespace (and not attached):
 [1] tidyselect_1.2.1        farver_2.1.2            blob_1.2.4              filelock_1.0.3          Biostrings_2.74.1       fastmap_1.2.0
 [7] BiocFileCache_2.14.0    digest_0.6.37           lifecycle_1.0.4         statmod_1.5.0           KEGGREST_1.46.0         invgamma_1.1
[13] RSQLite_2.3.9           magrittr_2.0.3          compiler_4.4.2          rlang_1.1.5             progress_1.2.3          tools_4.4.2
[19] labeling_0.4.3          prettyunits_1.2.0       S4Arrays_1.6.0          bit_4.5.0.1             curl_6.2.1              DelayedArray_0.32.0
[25] xml2_1.3.6              RColorBrewer_1.1-3      abind_1.4-8             BiocParallel_1.40.0     purrr_1.0.4             withr_3.0.2
[31] grid_4.4.2              colorspace_2.1-1        ggplot2_3.5.1           scales_1.3.0            cli_3.6.4               crayon_1.5.3
[37] generics_0.1.3          httr_1.4.7              tzdb_0.4.0              DBI_1.2.3               cachem_1.1.0            stringr_1.5.1
[43] zlibbioc_1.52.0         parallel_4.4.2          AnnotationDbi_1.68.0    XVector_0.46.0          vctrs_0.6.5             Matrix_1.7-1
[49] jsonlite_1.9.0          hms_1.1.3               mixsqp_0.3-54           bit64_4.6.0-1           irlba_2.3.5.1           locfit_1.5-9.11
[55] glue_1.8.0              codetools_0.2-20        stringi_1.8.4           gtable_0.3.6            UCSC.utils_1.2.0        munsell_0.5.1
[61] pillar_1.10.1           rappdirs_0.3.3          truncnorm_1.0-9         GenomeInfoDbData_1.2.13 R6_2.6.1                dbplyr_2.5.0
[67] httr2_1.1.0             rprojroot_2.0.4         vroom_1.6.5             lattice_0.22-6          png_0.1-8               SQUAREM_2021.1
[73] memoise_2.0.1           renv_1.0.11             Rcpp_1.0.14             zip_2.3.2               SparseArray_1.6.1       pkgconfig_2.0.3
However, when I looked at my gene of interest I was surprised to see that it was not flagged as significantly differentially expressed. Here are the stats for the gene:

This was surprising to me since the normalised count data for this gene looks like it is significantly DE between my groups of interest ("V_VC" vs "V_VC_CD45") and in a fairly consistent manner between the replicates (columns 1,2 and 7,8):

Here is the unnormalised count data just FYI:

Here is an example of a gene with similar count differences (both between and within groups) but has been flagged as significant:

normalised count data for this additional gene:

I saw this post ( enter link description here ) about a similar issue but the conclusion, if I understood correctly, was that the gene was interest was not flagged due to high within group count variability. In my case, since there doesn't seem to be as much count variability, I don't understand why that gene was not flagged as differentially expressed.
I would appreciate any help in understanding what's going on and what I can do about this.
Thank you!

No? Your CD45 samples range on normalized scale from 2 to 3255. That's 3 orders of magnitude. I would call that quite some heavy variability. I hope I typed that all down correctly, next time please use dput to provide data for reproduction:
Thank you both for your reply and your time! Sorry I didn't include this earlier but here it is (for the gene of interest):
There are actually 6 groups in the dataset with 2 replicates each. It would be helpful to know your thoughts on within group variability playing a role here. I'm struggling to understand since when I look at V_VC and V_VC_CD45, differences between replicates are not that big. Unless this is getting affected by differences seen within the other groups? and if so, do you think running deseq separately for each comparison would be a better approach, especially if I risk losing biologically interesting genes this way? (such as in enter link description here)
Thank you in advance for any help!
One clearly sees spread in this gene but it seems largely explained by "rep", so some sort of batch effect that you are already accounting for in the design but on the other hand it's inconsistent, so sometimes rep1 is high and sometimes it's low, depending on group. There is not much you can do with n=2 and this spread, I don't see how one could magically solve the underpowerment here. What you can try is limma-voom with quality weigts to maybe squeeze some more power out if few samples are consistent outliers, but I doubt that solves it here other than doing more n in the future.
Thank you for the quick reply. Rep 1 is lower than rep 2 in only one group (V_CD45), is this sufficient to affect the results even if I include "rep" in the design?
Would you advice against running deseq separately for each comparison?
You're reducing power even more. Look, since you appear a bit "desperate" you likely gonna try every possible option anyway, therefore I just repeat that you should not expect too much from n=2. If genewise significances cannot be achieved maybe go for GSEA or something like that.
Sorry for the repetitive questions! I'm actually just trying to understand it better so that I can explain to the wet lab biologists in my group why DEA isn't picking up on a gene they are very interested in :) I totally agree with you that more n would be ideal.
Underpowerment and notable noise/variability, that's the answer.
I also realised that the other gene I pointed out that was flagged as DE but had similar count differences also shows that rep1 is lower than rep 2 in V_VC_CD45. When you say that the reason why the other gene was not flagged was because of inconsistencies between replicates, I'm struggling to understand why this gene was flagged as DE and not the other.
I've also included an additional gene (second plot) as an example where the within group variability is less consistent between groups, in addition to inconsistencies between replicates but the gene was still flagged as DE (padj = 0.02).
Counts for gene that was flagged as DE between V_VC and V_VC_CD45:
Counts for another gene that was flagged as DE between V_VC and V_VC_CD45:
counts for gene of interest not flagged as DE between V_VC and V_VC_CD45: