
I'm doing a differential gene expression analysis and am working on getting the design model right with DESeq2.
The data I'm working is split by sex and three different groups, so Males/females and groups control/E/S.
I do want to analyze the interaction terms as well so from what I gather my model design should be:
dds1 <- DESeqDataSetFromMatrix(countData = round(countsTable),
                              colData = chars,
                              design= ~ sex + group + sex:group)
This gives me these resultsnames:
> resultsNames(dds1)
[1] "Intercept"                  "sex_Male_vs_Female"         "group_E_vs_control"
[4] "group_S_vs_control"  "sexMale.groupE"     "sexMale.groupS"
The vignette at https://bioconductor.org/packages/release/bioc/vignettes/DESeq2/inst/doc/DESeq2.html#interactions also recommends combining factors of interest into a single factor for simplicity, which I quite like so I decided to try this as well (saving the results in separate objects).
gchars <- select(chars,biopsy, sex, group)
gchars$grp <- paste(substring(chars$sex,1,1), toupper(substring(chars$group,1,1)),sep="")
# Male control = "MC", Male E = "ME", Male S = "MS", Female control ="FC", Female E = "FE", Female S = "FS"

dds2 <- DESeqDataSetFromMatrix(countData = round(countsTable),
                              colData = gchars,
                              design= ~grp)
As I write this I'm realizing just how long the post is getting, so I'll put the crux of my question here and you can continue reading if you're brave enough
" This has been a long winded way to say "I don't know what I'm doing when it comes to working with coefficients, please help me figure this out". Something has to be wrong with the model, but I can't figure out what. Is it the interaction term messing things up? At the most basic level, I don't understand why contrast=list("sex_Male_vs_Female") and contrast=c("grp","MC","FC") doesn't result in the same thing and I can't really move on with my analysis until I am confident in what I have produced. "
Now I'm running results checks on these to see of what I interpret as equivalent result sets match up, which they don't exactly.
As far as I understand, these two should produce the same result (my understanding of how coefficients work mainly comes from this guide https://www.r-bloggers.com/2024/05/a-guide-to-designs-and-contrasts-in-deseq2/):
a <- results(dds1,contrast = list("sex_Male_vs_Female"))

b <- results(dds2,contrast = c("grp","MC","FC"))
But if I check how many significantly differentially expressed genes there are I don't get the same number
nrow(as.data.frame(a) %>% dplyr::filter(padj<0.05 & !is.na(padj)))
#2255
nrow(as.data.frame(b) %>% dplyr::filter(padj<0.05 & !is.na(padj)))
#2257
The log2Foldchange also isn't the same, in some places it's remarkably different and in others it matches exactly.
I've ran all of my result sets and they're all slightly different from each other. A further example of how I might be messing this up is males vs females in group S, where something strange happens. I identified 3 genes that didn't match (based on significant padj value) and checked the results:
a <-as.data.frame(results(dds1,contrast = list(c("sex_Male_vs_Female","sexMale.groupS"))))
b <-as.data.frame(results(dds,contrast = c("grp","MS","FS")))

> a %>% filter(row.names(a) %in% c("Gene1", "Gene2", "Gene3"))
                   baseMean log2FoldChange     lfcSE      stat       pvalue         padj
Gene1           1741.400065      0.4440173 0.1703821  2.606009 9.160418e-03 0.0499905341
Gene2              2.241642    -23.1725820 4.9802849 -4.652863 3.273582e-06 0.0001350323
Gene3              9.213131     -6.5676793 2.4820302 -2.646092 8.142775e-03 0.0459282687

> b %>% filter(row.names(b) %in% c("Gene1", "Gene2", "Gene3"))
                   baseMean log2FoldChange     lfcSE      stat      pvalue       padj
Gene1           1741.400065      0.4440173 0.1703821  2.606008 0.009160419 0.05001478
Gene2              2.241642     -6.6518890 4.9803882 -1.335617 0.181674634 0.38005827
Gene3              9.213131      0.0000000 2.4820431  0.000000 1.000000000 1.00000000
When I look at these genes in the counts table I can see that Gene3 has no counts at all for group S, so the results in "b" above makes sense, there shouldn't be any fold change in Gene3. So where does the fold change come from in "a"? You might also notice that Gene2 has a drastically different log2fc and is highly significant in one set but not at all in the other.
This has been a long winded way to say "I don't know what I'm doing when it comes to working with coefficients, please help me figure this out". Something has to be wrong with the model, but I can't figure out what. Is it the interaction term messing things up? At the most basic level, I don't understand why contrast=list("sex_Male_vs_Female") and contrast=c("grp","MC","FC") doesn't result in the same thing and I can't really move on with my analysis until I am confident in the data I have produced.
happy friday
edit: changed group names to avoid confusion with the reference (control should automatically become the reference)
EDIT the second:
So I MAY have found the reason. To be clear, the issue was that I was seeing a fold change on a gene which, in the comparison I was making (male vs female in group S), had a total count of 0. When using a combined factor and contrast like described above I saw a fold change of 0, but using the coefficients I did not. I did a lot of testing and dug around using mcols() to no avail but eventually stumbled onto this in the vignette (under Differential expression analysis):
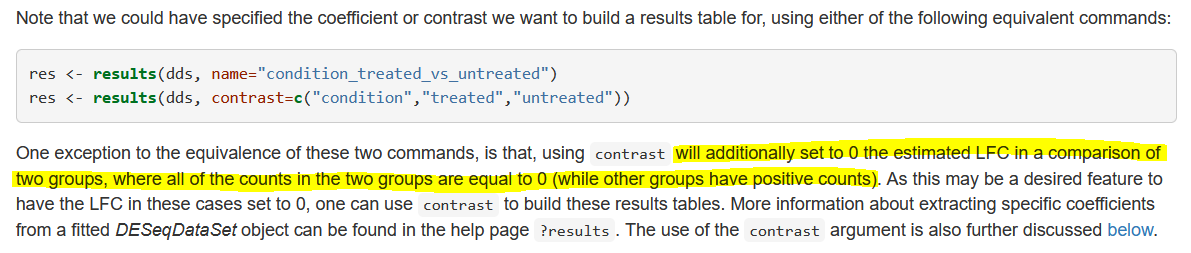
While I'm using contrast to compare the coefficients (sex_Male_vs_Female, sexMale.groupS) they aren't both 0 by themselves. Meaning an estimated foldchange could be included and cause the result. Pure speculation, in case someone finds this in the future.

My two cents. I think it would be more straightforward if you use cellmeans model. Have a look at A guide to creating design matrices for gene expression experiments. In short, if you try
0 + grpfor your model, it will give you no intercept, and you may find it easy to combine coefficients to form a contrast matrix.