Hi everyone,
I am analysing an RNAseq dataset where despite the count data showing differences between groups of interest (and not much within group), a gene is not being flagged as differentially expressed. I would like to understand why this is and what I can do!
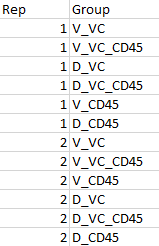
The coldata is as follows:
My code for finding DE genes between groups while controlling for replicates is as follows:
dds <- DESeqDataSetFromTximport(txi, colData = meta,
                                             design = ~Rep + Group,
                                             rowData = rowdata)

keep <- filterByExpr(dds, group = dds$Group)
dds <- dds[keep,]

dds <- estimateSizeFactors(dds)

deseq <- DESeq(dds)

res <- results(deseq, contrast = c("Group", "V_VC", "V_VC_CD45"), alpha = 0.05, tidy = TRUE)

sessionInfo( )
R version 4.4.2 (2024-10-31 ucrt)
Platform: x86_64-w64-mingw32/x64
Running under: Windows 11 x64 (build 22631)

Matrix products: default


locale:
[1] LC_COLLATE=English_United Kingdom.utf8  LC_CTYPE=English_United Kingdom.utf8    LC_MONETARY=English_United Kingdom.utf8
[4] LC_NUMERIC=C                            LC_TIME=English_United Kingdom.utf8

time zone: Europe/London
tzcode source: internal

attached base packages:
[1] stats4    stats     graphics  grDevices datasets  utils     methods   base

other attached packages:
 [1] ashr_2.2-63                 edgeR_4.4.2                 limma_3.62.2                tximport_1.34.0             biomaRt_2.62.1
 [6] pheatmap_1.0.12             DESeq2_1.46.0               SummarizedExperiment_1.36.0 Biobase_2.66.0              MatrixGenerics_1.18.1
[11] matrixStats_1.5.0           GenomicRanges_1.58.0        GenomeInfoDb_1.42.3         IRanges_2.40.1              S4Vectors_0.44.0
[16] BiocGenerics_0.52.0         here_1.0.1                  tibble_3.2.1                readr_2.1.5                 openxlsx_4.2.8
[21] dplyr_1.1.4

loaded via a namespace (and not attached):
 [1] tidyselect_1.2.1        farver_2.1.2            blob_1.2.4              filelock_1.0.3          Biostrings_2.74.1       fastmap_1.2.0
 [7] BiocFileCache_2.14.0    digest_0.6.37           lifecycle_1.0.4         statmod_1.5.0           KEGGREST_1.46.0         invgamma_1.1
[13] RSQLite_2.3.9           magrittr_2.0.3          compiler_4.4.2          rlang_1.1.5             progress_1.2.3          tools_4.4.2
[19] labeling_0.4.3          prettyunits_1.2.0       S4Arrays_1.6.0          bit_4.5.0.1             curl_6.2.1              DelayedArray_0.32.0
[25] xml2_1.3.6              RColorBrewer_1.1-3      abind_1.4-8             BiocParallel_1.40.0     purrr_1.0.4             withr_3.0.2
[31] grid_4.4.2              colorspace_2.1-1        ggplot2_3.5.1           scales_1.3.0            cli_3.6.4               crayon_1.5.3
[37] generics_0.1.3          httr_1.4.7              tzdb_0.4.0              DBI_1.2.3               cachem_1.1.0            stringr_1.5.1
[43] zlibbioc_1.52.0         parallel_4.4.2          AnnotationDbi_1.68.0    XVector_0.46.0          vctrs_0.6.5             Matrix_1.7-1
[49] jsonlite_1.9.0          hms_1.1.3               mixsqp_0.3-54           bit64_4.6.0-1           irlba_2.3.5.1           locfit_1.5-9.11
[55] glue_1.8.0              codetools_0.2-20        stringi_1.8.4           gtable_0.3.6            UCSC.utils_1.2.0        munsell_0.5.1
[61] pillar_1.10.1           rappdirs_0.3.3          truncnorm_1.0-9         GenomeInfoDbData_1.2.13 R6_2.6.1                dbplyr_2.5.0
[67] httr2_1.1.0             rprojroot_2.0.4         vroom_1.6.5             lattice_0.22-6          png_0.1-8               SQUAREM_2021.1
[73] memoise_2.0.1           renv_1.0.11             Rcpp_1.0.14             zip_2.3.2               SparseArray_1.6.1       pkgconfig_2.0.3
However, when I looked at my gene of interest I was surprised to see that it was not flagged as significantly differentially expressed. Here are the stats for the gene:
This was surprising to me since the normalised count data for this gene looks like it is significantly DE between my groups of interest ("V_VC" vs "V_VC_CD45") and in a fairly consistent manner between the replicates (columns 1,2 and 7,8):
Here is the unnormalised count data just FYI:
Here is an example of a gene with similar count differences (both between and within groups) but has been flagged as significant:
normalised count data for this additional gene:
I saw this post ( enter link description here ) about a similar issue but the conclusion, if I understood correctly, was that the gene was interest was not flagged due to high within group count variability. In my case, since there doesn't seem to be as much count variability, I don't understand why that gene was not flagged as differentially expressed.
I would appreciate any help in understanding what's going on and what I can do about this.
Thank you!


No? Your CD45 samples range on normalized scale from 2 to 3255. That's 3 orders of magnitude. I would call that quite some heavy variability. I hope I typed that all down correctly, next time please use dput to provide data for reproduction: