Please note that RMA is a method intended to normalize and summarize a set of samples rather than a single sample (it doesn't make much sense in the context of a single sample). You should instead get all the data and process as a set.
> library(GEOquery)


> options(timeout = 1e6)
> getGEOSuppFiles("GSE2990")
> setwd("GSE2990/")
> untar("GSE2990_RAW.tar")

> dat <- read.celfiles(list.celfiles(listGzipped = TRUE))
Loading required package: pd.hg.u133a

Loading required package: pd.hg.u133a
Loading required package: RSQLite
Loading required package: DBI
Platform design info loaded.
Reading in : gsm65316.cel.gz
Reading in : gsm65317.cel.gz

<snip>

Warning message:
package 'RSQLite' was built under R version 4.4.2
> eset <- rma(dat)
Background correcting
Normalizing
Calculating Expression
> exprs(eset)[1,1,drop = FALSE]
          gsm65316.cel.gz
1007_s_at        12.11781
That's closer than you got. It's not entirely clear how the submitter processed the data. They just say something like 'normal RMA'. If you really want their data, it's easy enough to do that as well
> z <- getGEO("GSE2990")[[1]]
Found 1 file(s)
GSE2990_series_matrix.txt.gz

> exprs(z)[1,1,drop = FALSE]
          GSM65316
1007_s_at 12.12325
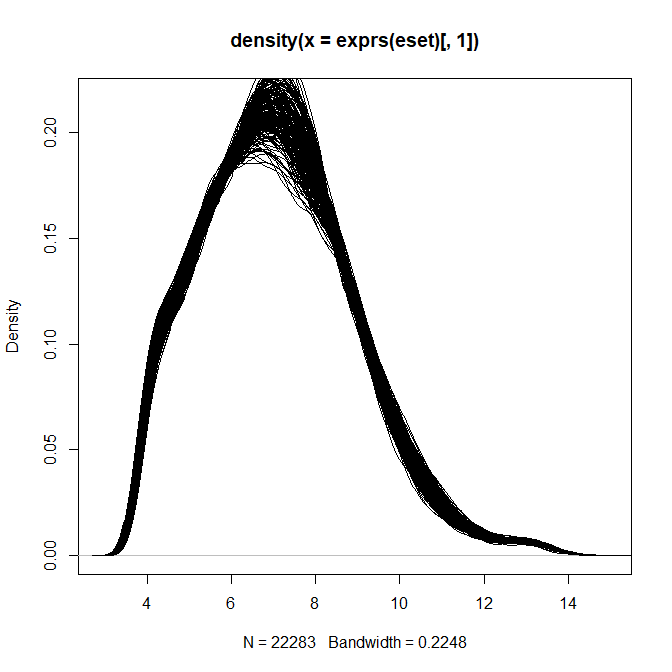
But there's something weird going on with the normalization that the submitter performed.
> plot(density(exprs(eset)[,1]))
> for(i in 2:ncol(eset)) lines(density(exprs(eset)[,i]))
> plot(density(exprs(z)[,1]))
> for(i in 2:ncol(z)) lines(density(exprs(z)[,i]))
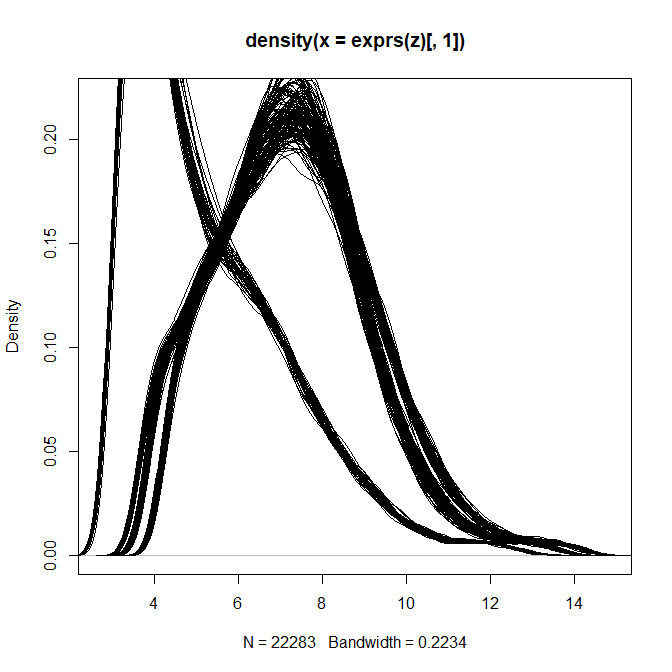
So I would probably just re-run the analysis using the raw data.


