
Hello,
I am running DEXseq, where I have adapted DEXseq to look at relative polyA site usage rather than relative exon usage. Upstream of running DEXseq, I called polyA sites in my dataset and got counts for the sites.
My concern is that when I look at my dispersion estimate plot:
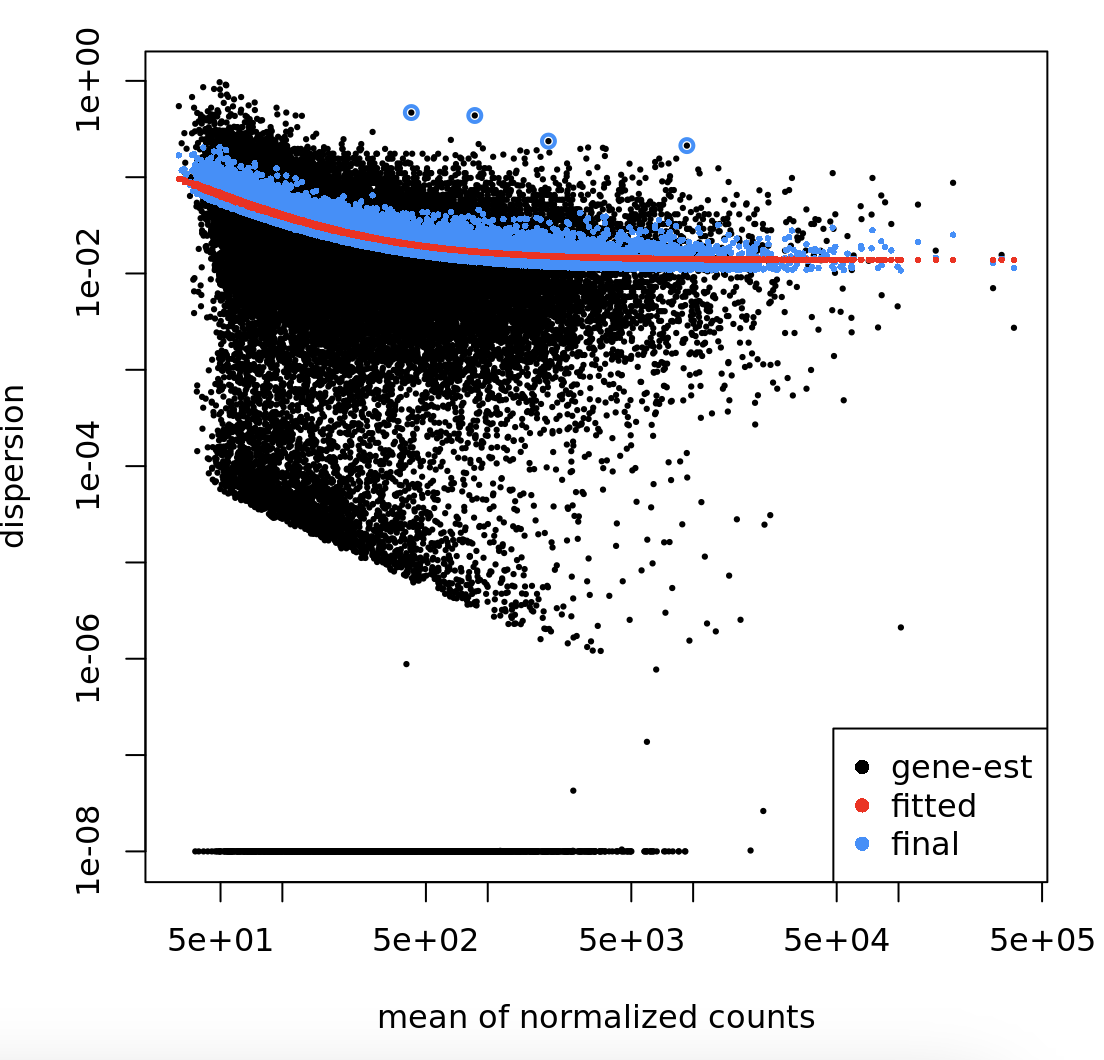
There is a secondary "cloud" of points around 1e-04.
Generally, what I'm wondering is: is this type of shape expected for the DEXseq dispersion estimate plots, or is this indicative of some type of artifact in my upstream data handling?
For a bit more context, I've tried different thresholding of the minimum # of counts for each feature in my dataset, and that doesn't seem to affect the shape of the dispersion estimate plot. There doesn't appear to be any correlations with the lengths of the features (some pA sites nearby each other are clustered together) or with adjusted p-values or with log fold change values.
Some specific sites also appear (to my eyes) to have very similar counts, but different dispersion estimates, such as:
A
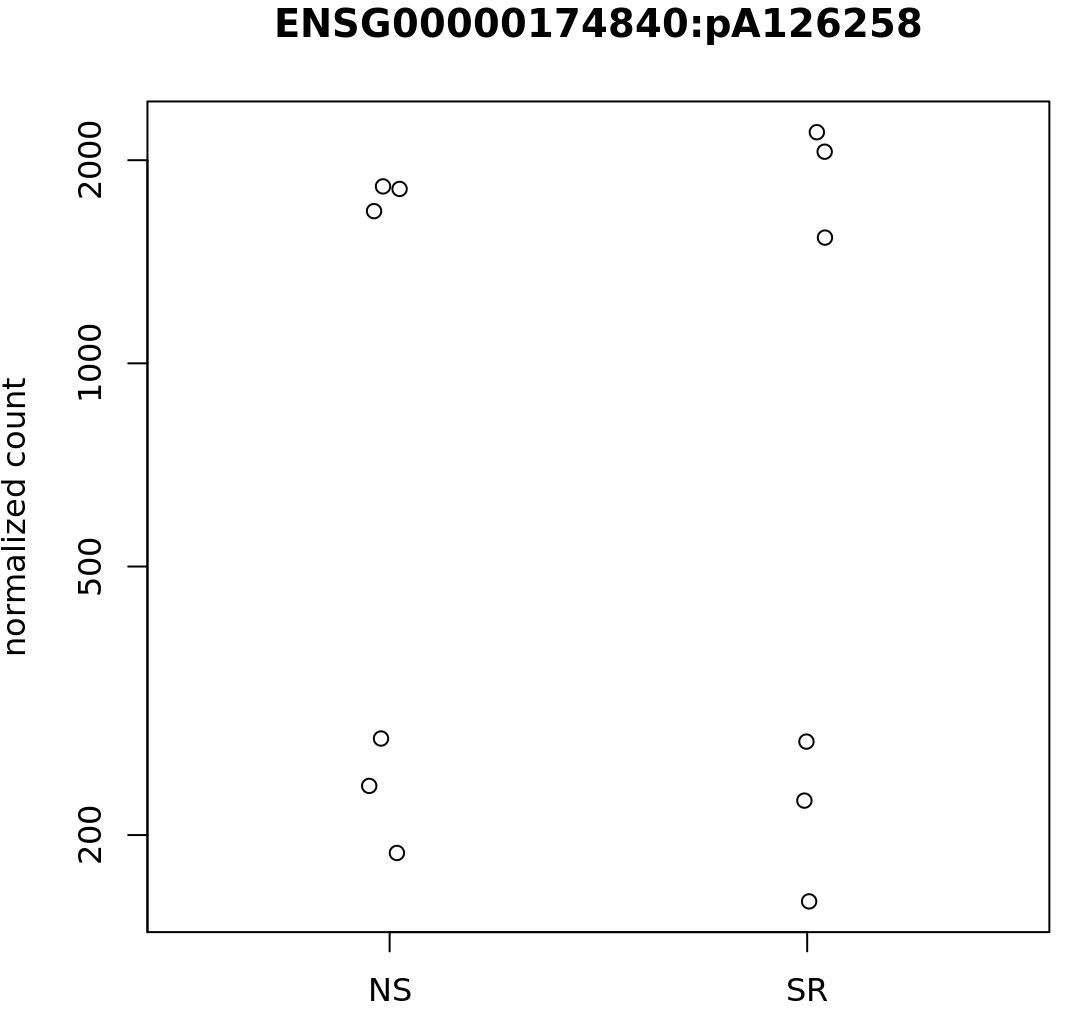
where the dispGeneEst is 2.330017e-05
and
B
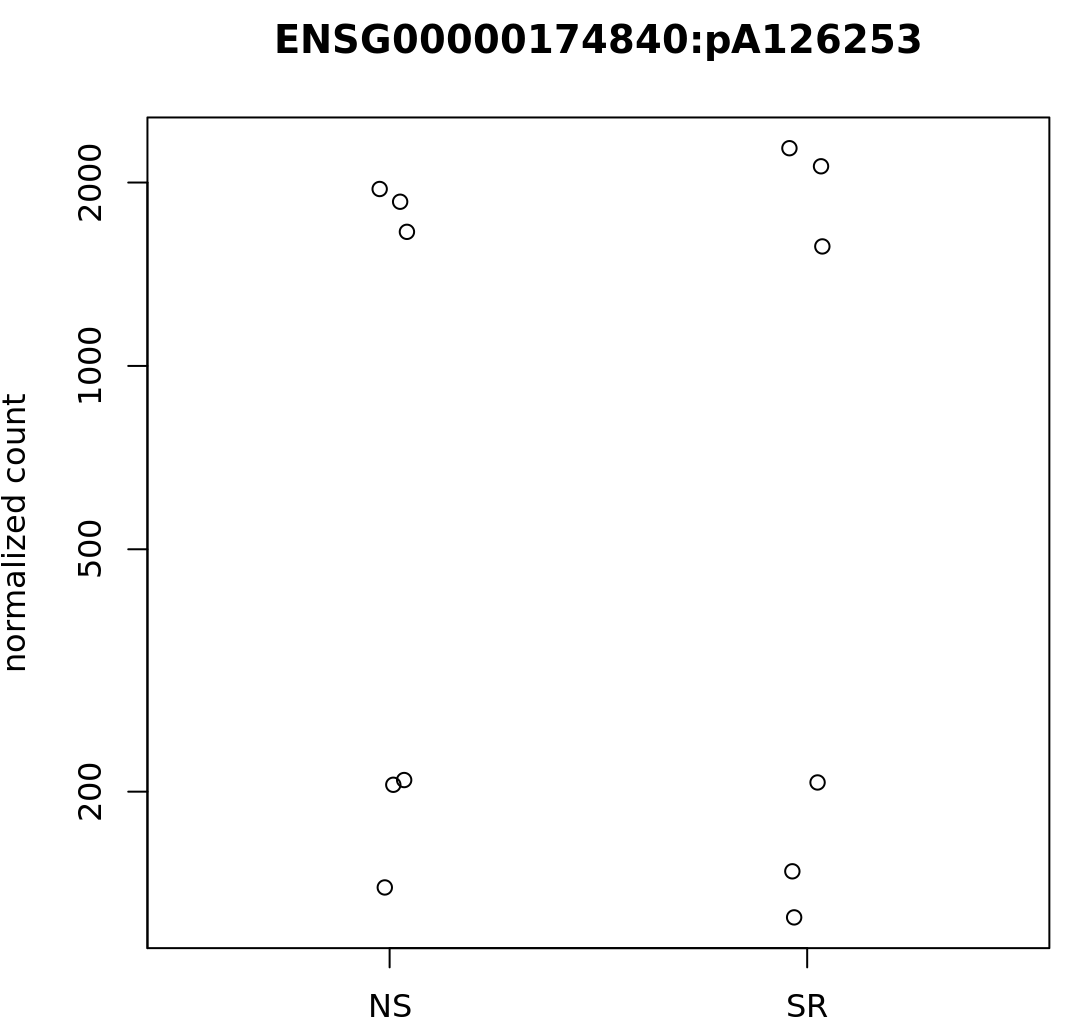
where the dispGeneEst is 5.466213e-02.
In fact, the only discernible difference between the two is that the dispGeneIter is 71 for A and 2 for B, and this trend of dispGeneIter being much higher for the sites with dispGeneEsts ~1e-04 seems true for many cases.
EDIT: Here is the dispersion estimate plot colored by the # of iterations to run, with red = higher # of iterations and blue = lower # of iterations:
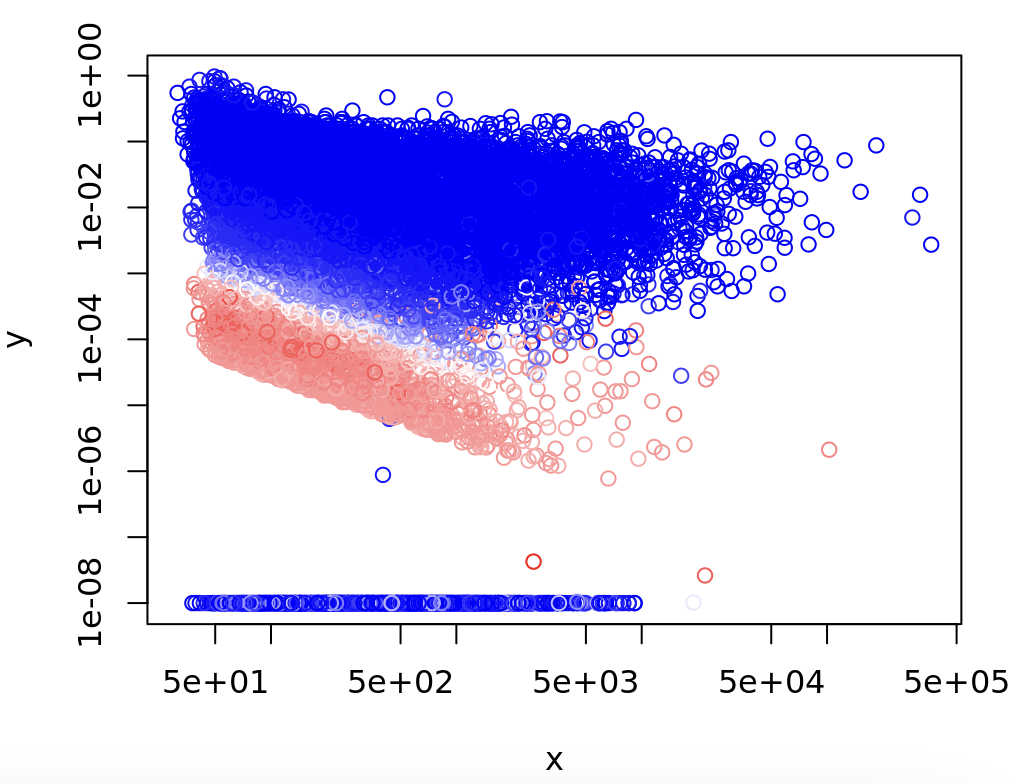
Is this behavior expected in DEXseq?
However, changing parameters that I thought might affect the MLE, such as niter to 20 or changing maxit to 500, does not have any significant affect on the plot either.
Thank you for any advice!
Code run pasted below:
print('set up for DEXseq analysis')

  #Set up for DEXSeq analysis
  dxd <- DEXSeqDataSet(countData, sampleInfo,
                 design= ~ sample + exon + type:exon + condition:exon,
                 featureID, GeneID)

  print('Carry out DEXSeq analysis main steps')

  dxd = estimateSizeFactors( dxd )

  formulaFullModel    =  ~ sample + exon + type:exon + condition:exon
  formulaReducedModel =  ~ sample + exon + type:exon
  dxd = estimateDispersions( dxd, formula = formulaFullModel)

  plotDispEsts( dxd )

R version 4.2.1 (2022-06-23)
Platform: x86_64-pc-linux-gnu (64-bit)
Running under: CentOS Linux 7 (Core)

Thank you so much for your quick reply! I was worried if some underlying technical artifact or unusual behavior would be causing the pattern seen with the red points - I appreciate your clarification that it's not concerning.