
Hello everyone ! I wanted to ask a particular question regarding the implementation of limma R package, for DE regarding proteomics multiplex immunoassay technologies. In particular, my experiment is related with blood samples and performed using targeted Olink assay panels. My major goal is to investigate if there are any protein expression differences based on two different profiled groups. The complete experiment was run in 3 separate plates (not completely randomized, but including individuals from both groups), yielding 3 distinct outputs, into 3 different excel files:
colnames(prot_dat)
 [1] "SampleID"                    "Index"                       "OlinkID"
 [4] "UniProt"                     "Assay"                       "MissingFreq"
 [7] "Panel"                       "Panel_Version"               "PlateID"
[10] "QC_Warning"                  "PlateLQL"                    "PlateLOD"
[13] "LLOQ"                        "ULOQ"                        "Quantified_value"
[16] "Unit"                        "Assay_Warning"               "Normalization"
[19] "QC Deviation Inc Ctrl"       "QC Deviation Det Ctrl"       "Olink NPX Signature Version"
In addition, the column "Normalization", in all 3 separate excel files, has the value "Calibrator Normalized". After thorough investigation, these numeric values represent the absolute quantification of the panel proteins, which depend on the included calibrator samples. This process brings all samples at the same scale (pg/ml), and hence (from the general guidelines), no additional "bridging" is required to make these runs directly comparable to each other. In parallel, from a direct comparison of total protein expression distribution across the 3 plates, there was not any significant difference between the 3 plates; Hence, I proceeded with direct merging of all plates into a concatenated dataset. On this premise, my main questions is the following:
range(prot_dat$Quantified_value, na.rm = TRUE)
[1] 0.00122 15801.02184
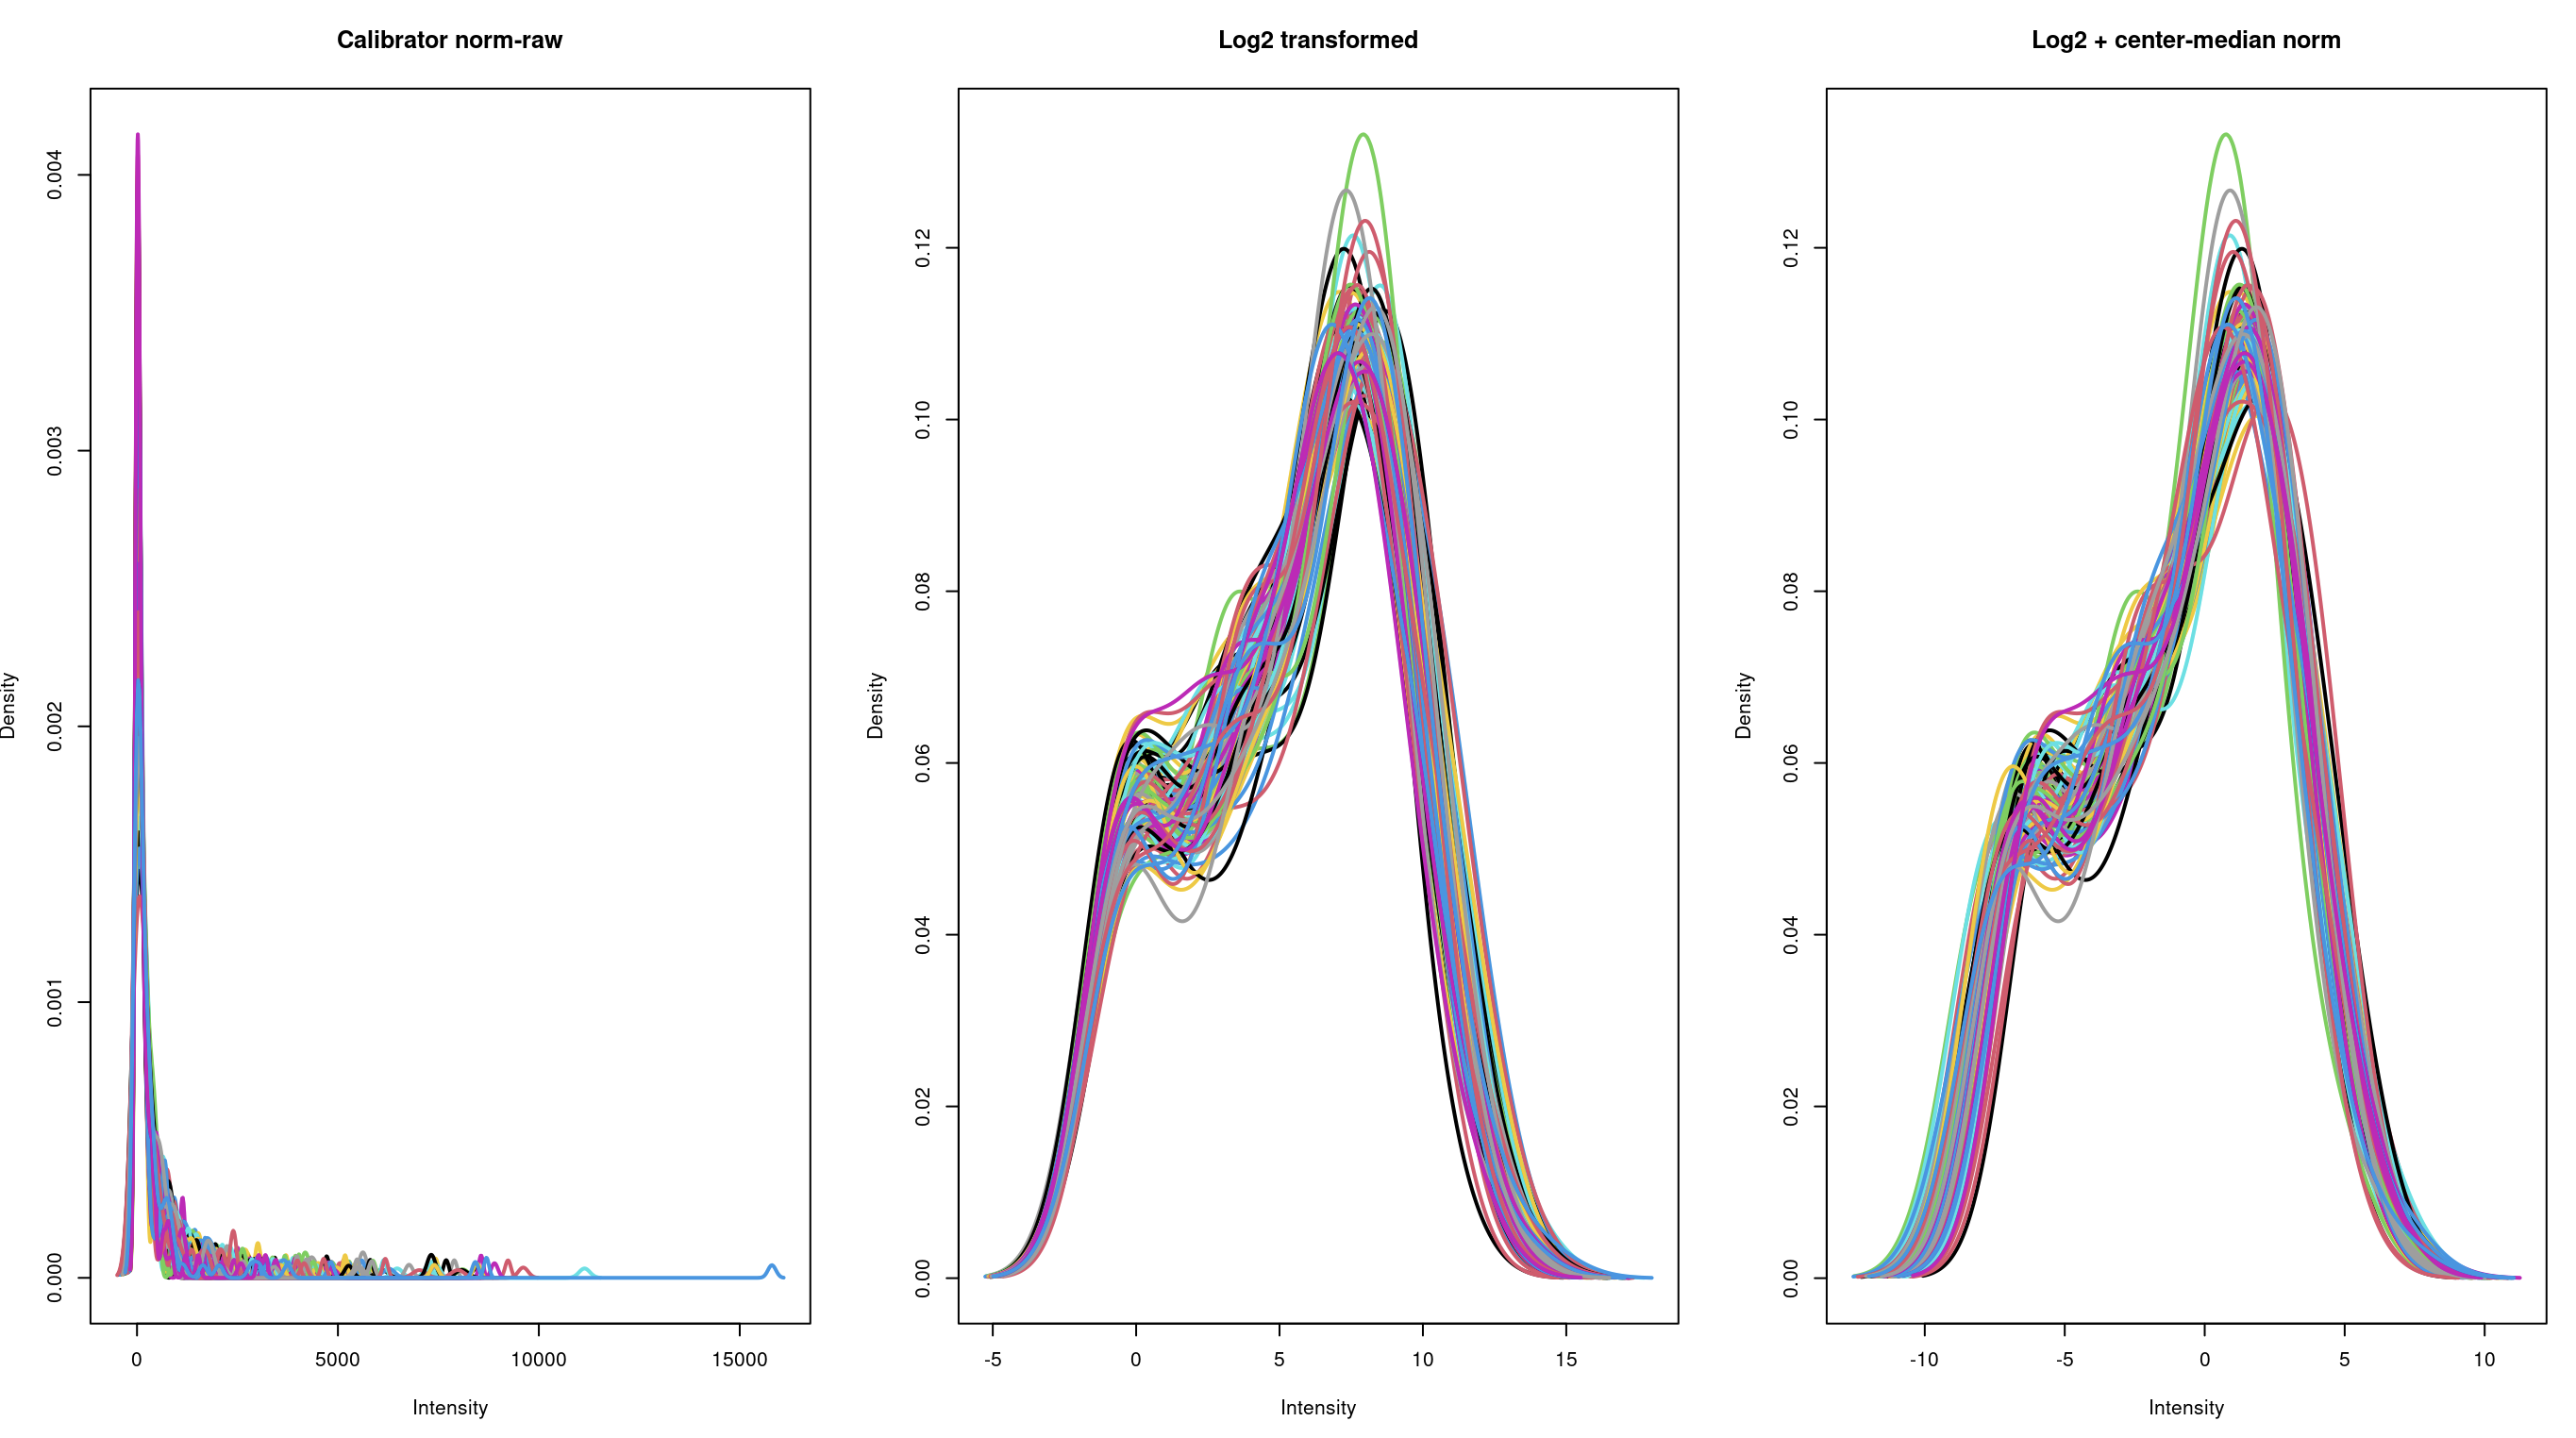
In the column "Quantified_value", the values are ranging from 0 to some thousands, like 2000; I also utilized a simple log2 (+0.5) transformation, as well as an additional median-center transformation. But if you check the below density plots, there is not much difference between log2 alone, vs additional median centering, thus:
For differential expression with limma, and based on my above description, even the log2 transformation could suffice? In addition, although there are limited features in total (~89), still the limma-trend pipeline might be beneficial for a basic two-group comparison, potentially including some categorical confounders?
Thank's a gazillion,
Efstathios

Dear Gordon, thanks a million for your reply (just saw it, did not get any notification through email) !! Regarding the log2 transformation, from your experience, adding an "arbitrary" constant ~0.5 to account for any putatively "0" values would also suffice?
I don't know what the "quantified value" is in your output so I can't advise you on it. It is not part of Olink output that I have seen. Olink generally outputs an "NPX" value, which is a normalized value already on the log-scale. According to Olink, you should be using that for any downstream analyses, including in limma.
Dear Gordon, thank you for returning back ! Actually the output is not "NPX"-as indeed it most frequent output for a lot of pannels-but as mentioned, these are absolute quantification values in pg/ml (based on internal calibrator normalization, in order for the values to be comparable across the different plates); hence no log2 transformation like NPX; the range of the values is like depicted above, thus not any values that are "actual" 0; That is why I was wondering if adding any constant-depending on the range-would alter significantly especially the negative values after log2 transform, and it would be "less biased" to just do a simple log2 transformation without adding any constants..