Entering edit mode

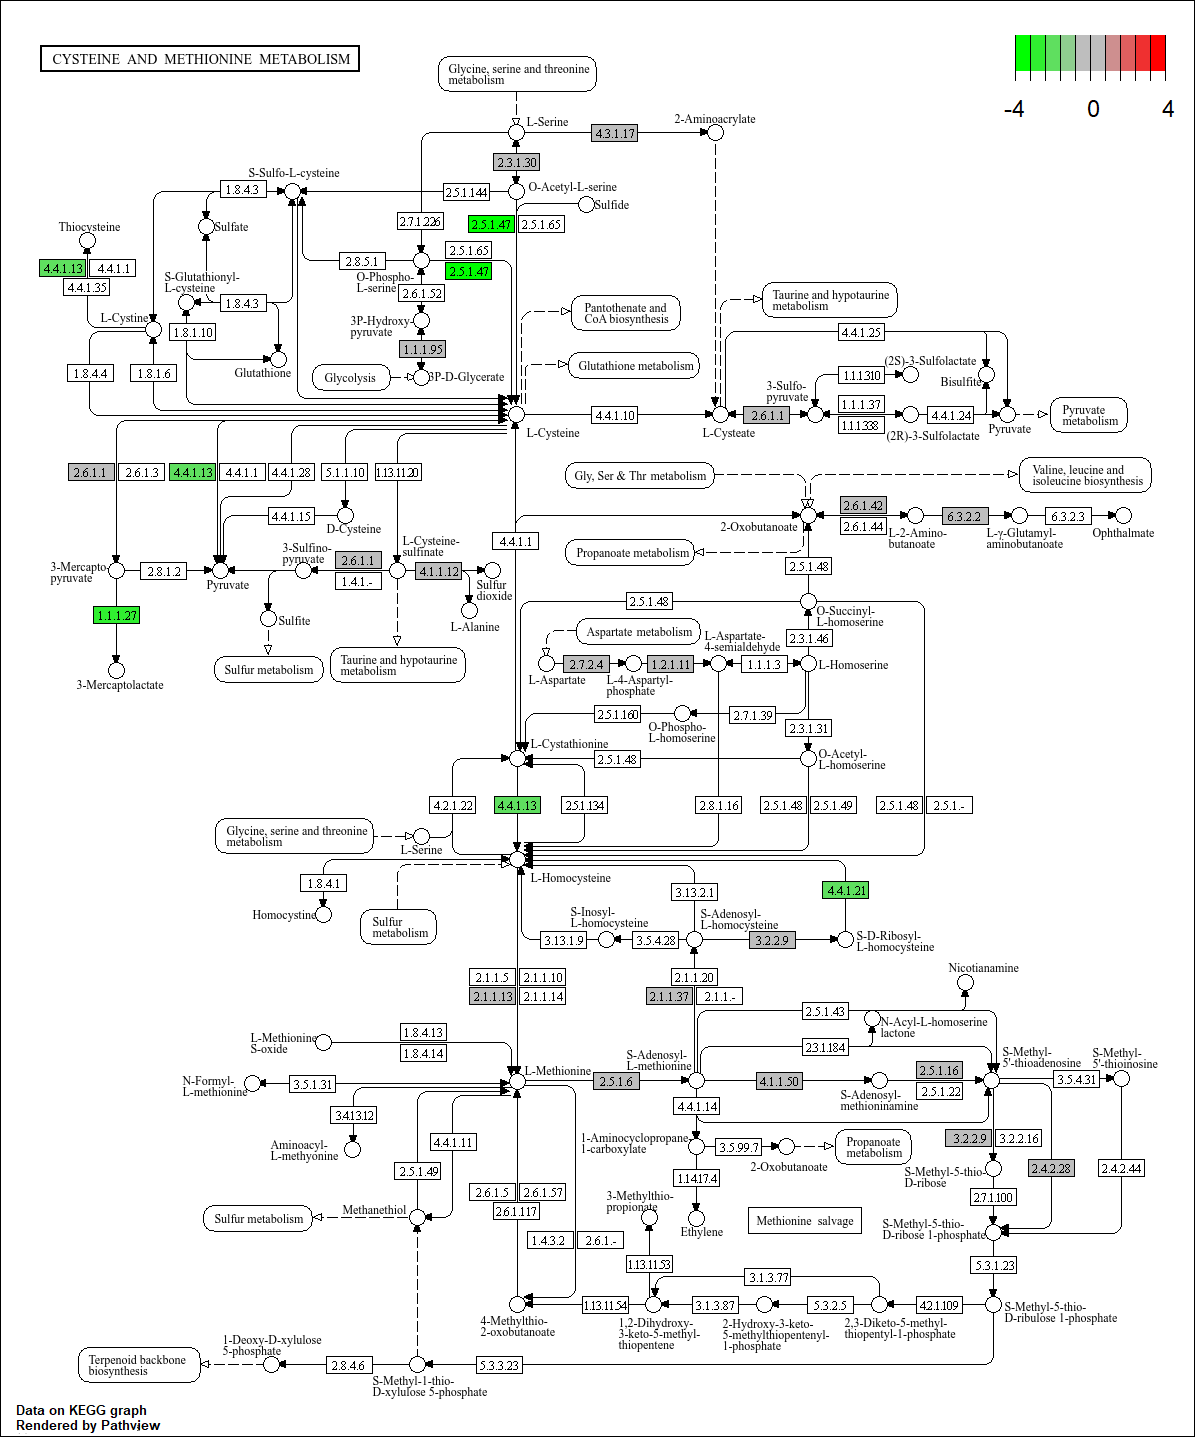
Hi all! New to bioinformatics here. I've been trying to use pathview in R to visualise differential proteomics data. I did GSEA using GSEkegg and now I'm trying to visualise the differentially expressed pathways using pathview. I'm having an issue with the output, however (see attached image). The upregulated genes are just greyed out.
Data is a csv file with two columns: gene name in KEGG format, then log2fold change values in the second column.
Code is below.
> data <- read.csv("pathview_input_AN_OX.csv", header=FALSE)
> geneList = data[,2] #importing fold change data as a vector
> names(geneList) = as.character(data[,1]) #adding gene name to vector
> summary(geneList) #check vector
    Min.  1st Qu.   Median     Mean  3rd Qu.     Max.
-3.40000 -0.24200  0.01875 -0.01173  0.25500  2.80000
> str(geneList) #check vector
 Named num [1:1906] 2.8 2.65 2.24 2.19 1.94 1.77 1.43 1.38 1.36 1.22 ...
 - attr(*, "names")= chr [1:1906] "CPF_2118" "CPF_1169" "CPF_1621" "CPF_2199" ...
> cpf000270 <- pathview(gene.data  = geneList,
+                      pathway.id = "cpf00270",
+                      gene.idtype="KEGG",
+                      species = "cpf",
+                      limit= list(gene=c(-4,4), cpd=1))
Note: Mapping via KEGG gene ID (not Entrez) is supported for this species,
it looks like "CPF_2670"!
Info: Downloading xml files for cpf00270, 1/1 pathways..
Info: Downloading png files for cpf00270, 1/1 pathways..
Info: Working in directory C:/Users/proteomics/CLUSTER PROFILER
Info: Writing image file cpf00270.pathview.png
Please let me know where I've gone wrong! Thanks :)
