Hello everyone, I have some question in building samplesheet:
- When I am using narrowPeak files for my peaks, what is the difference between filling in "bed" and "narrow" in the "PeakCaller" column?
- If my peak files are in the broadPeak format, how should I fill in the "PeakCaller" column for these files?
And I used the following code for analysis,
< samples <- dba(sampleSheet = "XX.csv", minOverlap = 2)
< samples SampleID Condition Replicate bamReads Peaks PeakCaller vec-1 vec 1 a1.bam a1.broadPeak bed vec-2 vec 2 a2.bam a2.broadPeak bed oe-1 oe 1 a1.bam a1.broadPeak bed oe-2 oe 2 a2.bam a2.broadPeak bed
< rm_blacklist <- dba.blacklist(samples, blacklist = DBA_BLACKLIST_MM10, greylist = F)
< blacklisted <- dba.blacklist(rm_blacklist, Retrieve = DBA_BLACKLISTED_PEAKS)
< count <- dba.count(rm_blacklist, summits=F, minOverlap = 2, bUseSummarizeOverlaps=TRUE)
< norm_count <- dba.normalize(count)
< contrast_count <- dba.contrast(norm_count, contrast=c("Condition", "vec", "oe"), minMembers = 2)
analysis_count <- dba.analyze(contrast_count, method=DBA_DESEQ2),
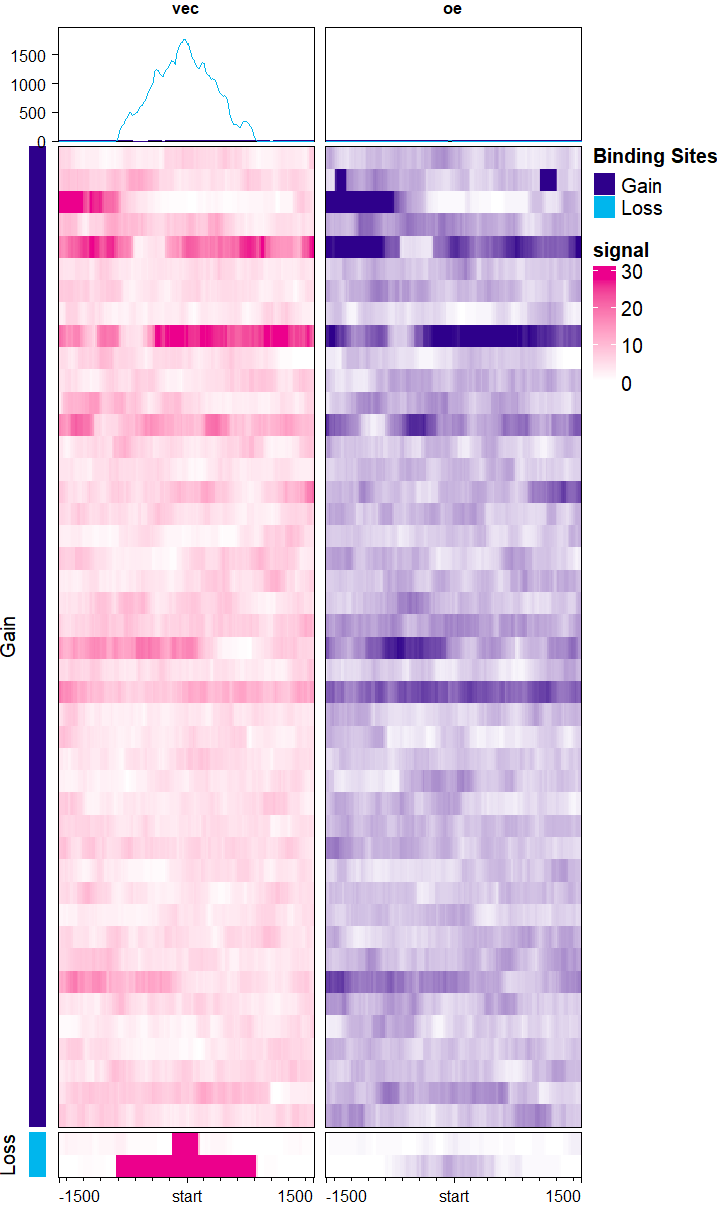
The analysis results show that I obtained 146 peaks with changes, Loss : 139, Gain: 7, and I use
profiles <- dba.plotProfile(analysis_count) dba.plotProfile(profiles)
But there are only vec have Loss lines in the Profile , no Gain lines, and the oe have no lines in Profile,
Could you please help me to solve these questions, thank you very much!