Hello,
I am performing WGCNA on RNA-seq data of 16 samples. I filtered the RNA-seq counts to obtain 18,841 genes and further performed batch correction and covariate adjustments on a vst transformed data using removebatcheffects().
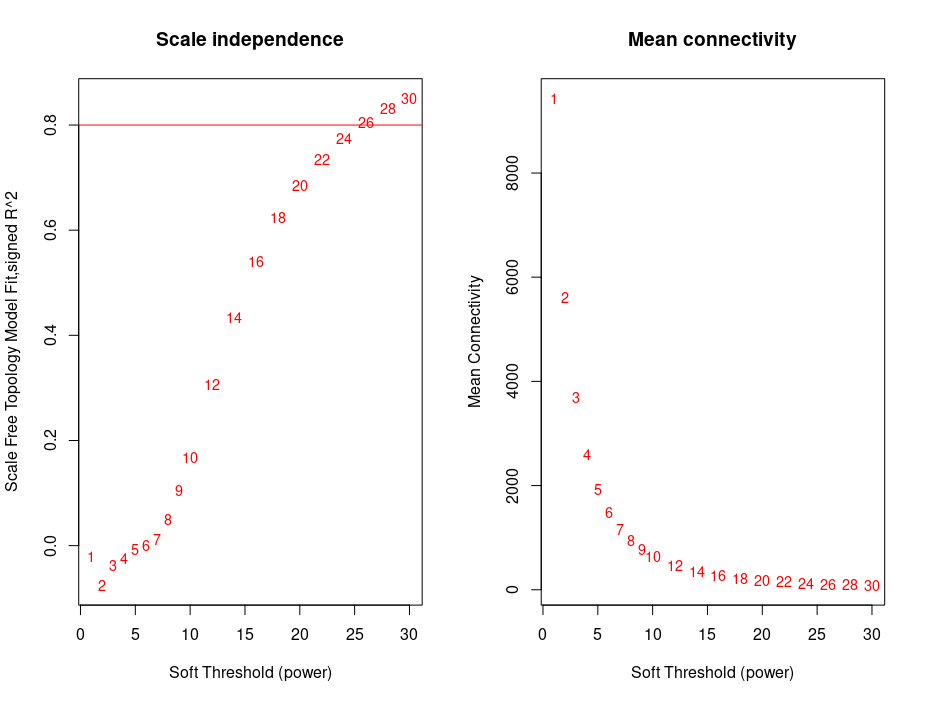
Further using picksoftthreshold() to select the power above R2 0.8.
I got the lowest power of 26 which was closest to 0.8 R2 (signed network).
Using this power I performed network and clustering
net = blockwiseModules(object, power = 26, maxBlockSize = 20000,
                        deepSplit = 0, networkType = "signed", minModuleSize = 30,
                        reassignThreshold = 0, mergeCutHeight = 0.25, numericLabels = FALSE,
                        saveTOMs = FALSE, verbose = 5)
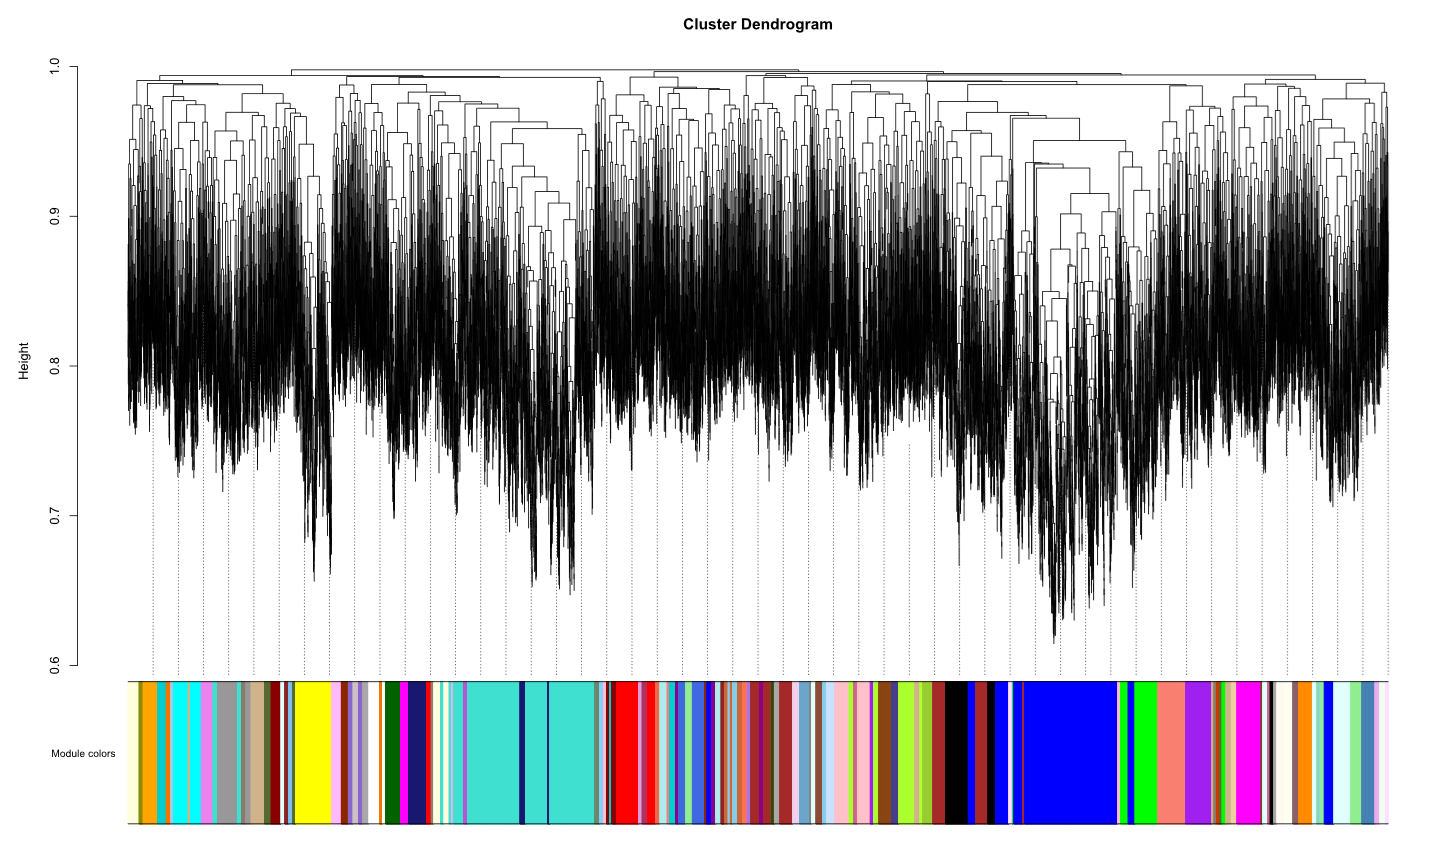
The cluster dendrogram I obtained was
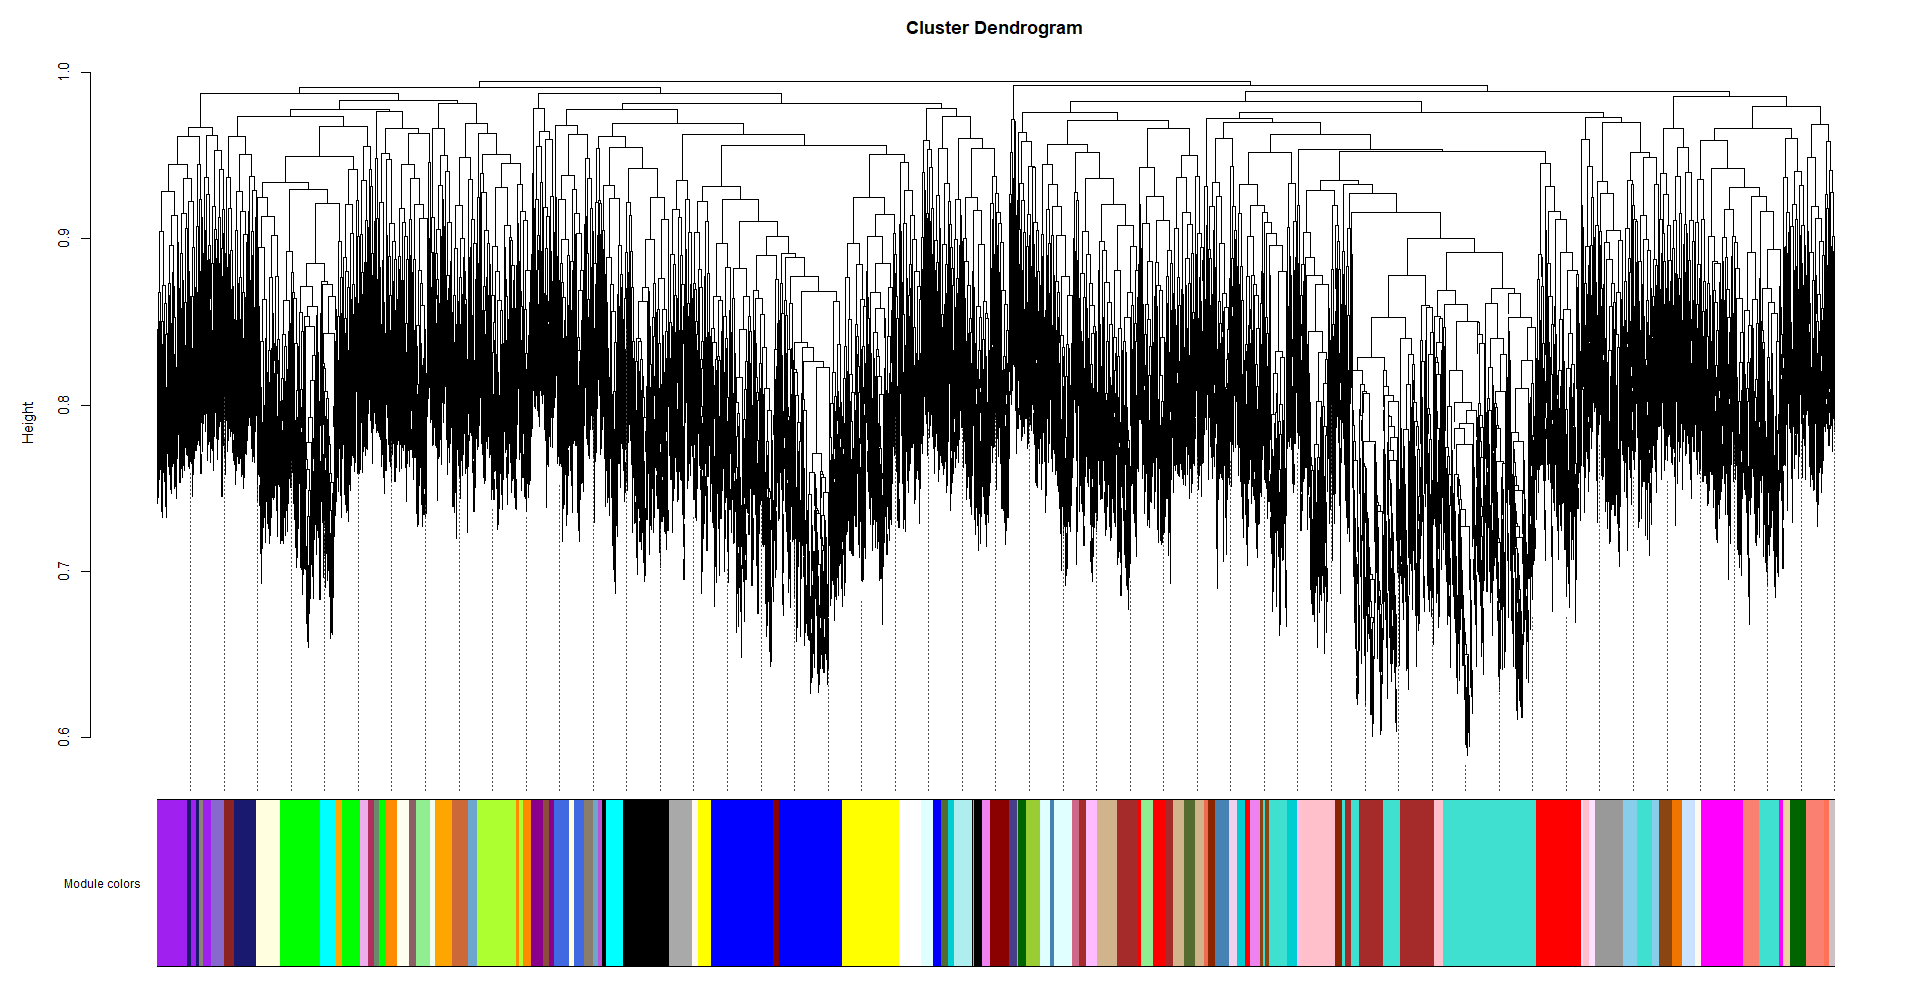
I recently read a post which suggested to use the table provided in WGCNA faq. The table suggests me to use the power 18 (samples less than 20) for signed network. I tried that and the dendrogram is as follows
My question here is (1) Is 26 power too high or we can go ahead with it? Should we go with low power i.e. 18? (2) The cluster dendrogram we have seen in various papers looks different from what we got. So is the obtained cluster dendrogram fine?
Is there any way I can improve my results?
Thank you


Hello,
Thank you for the response.
I have already raised the same question on biostars.