Hi everyone,
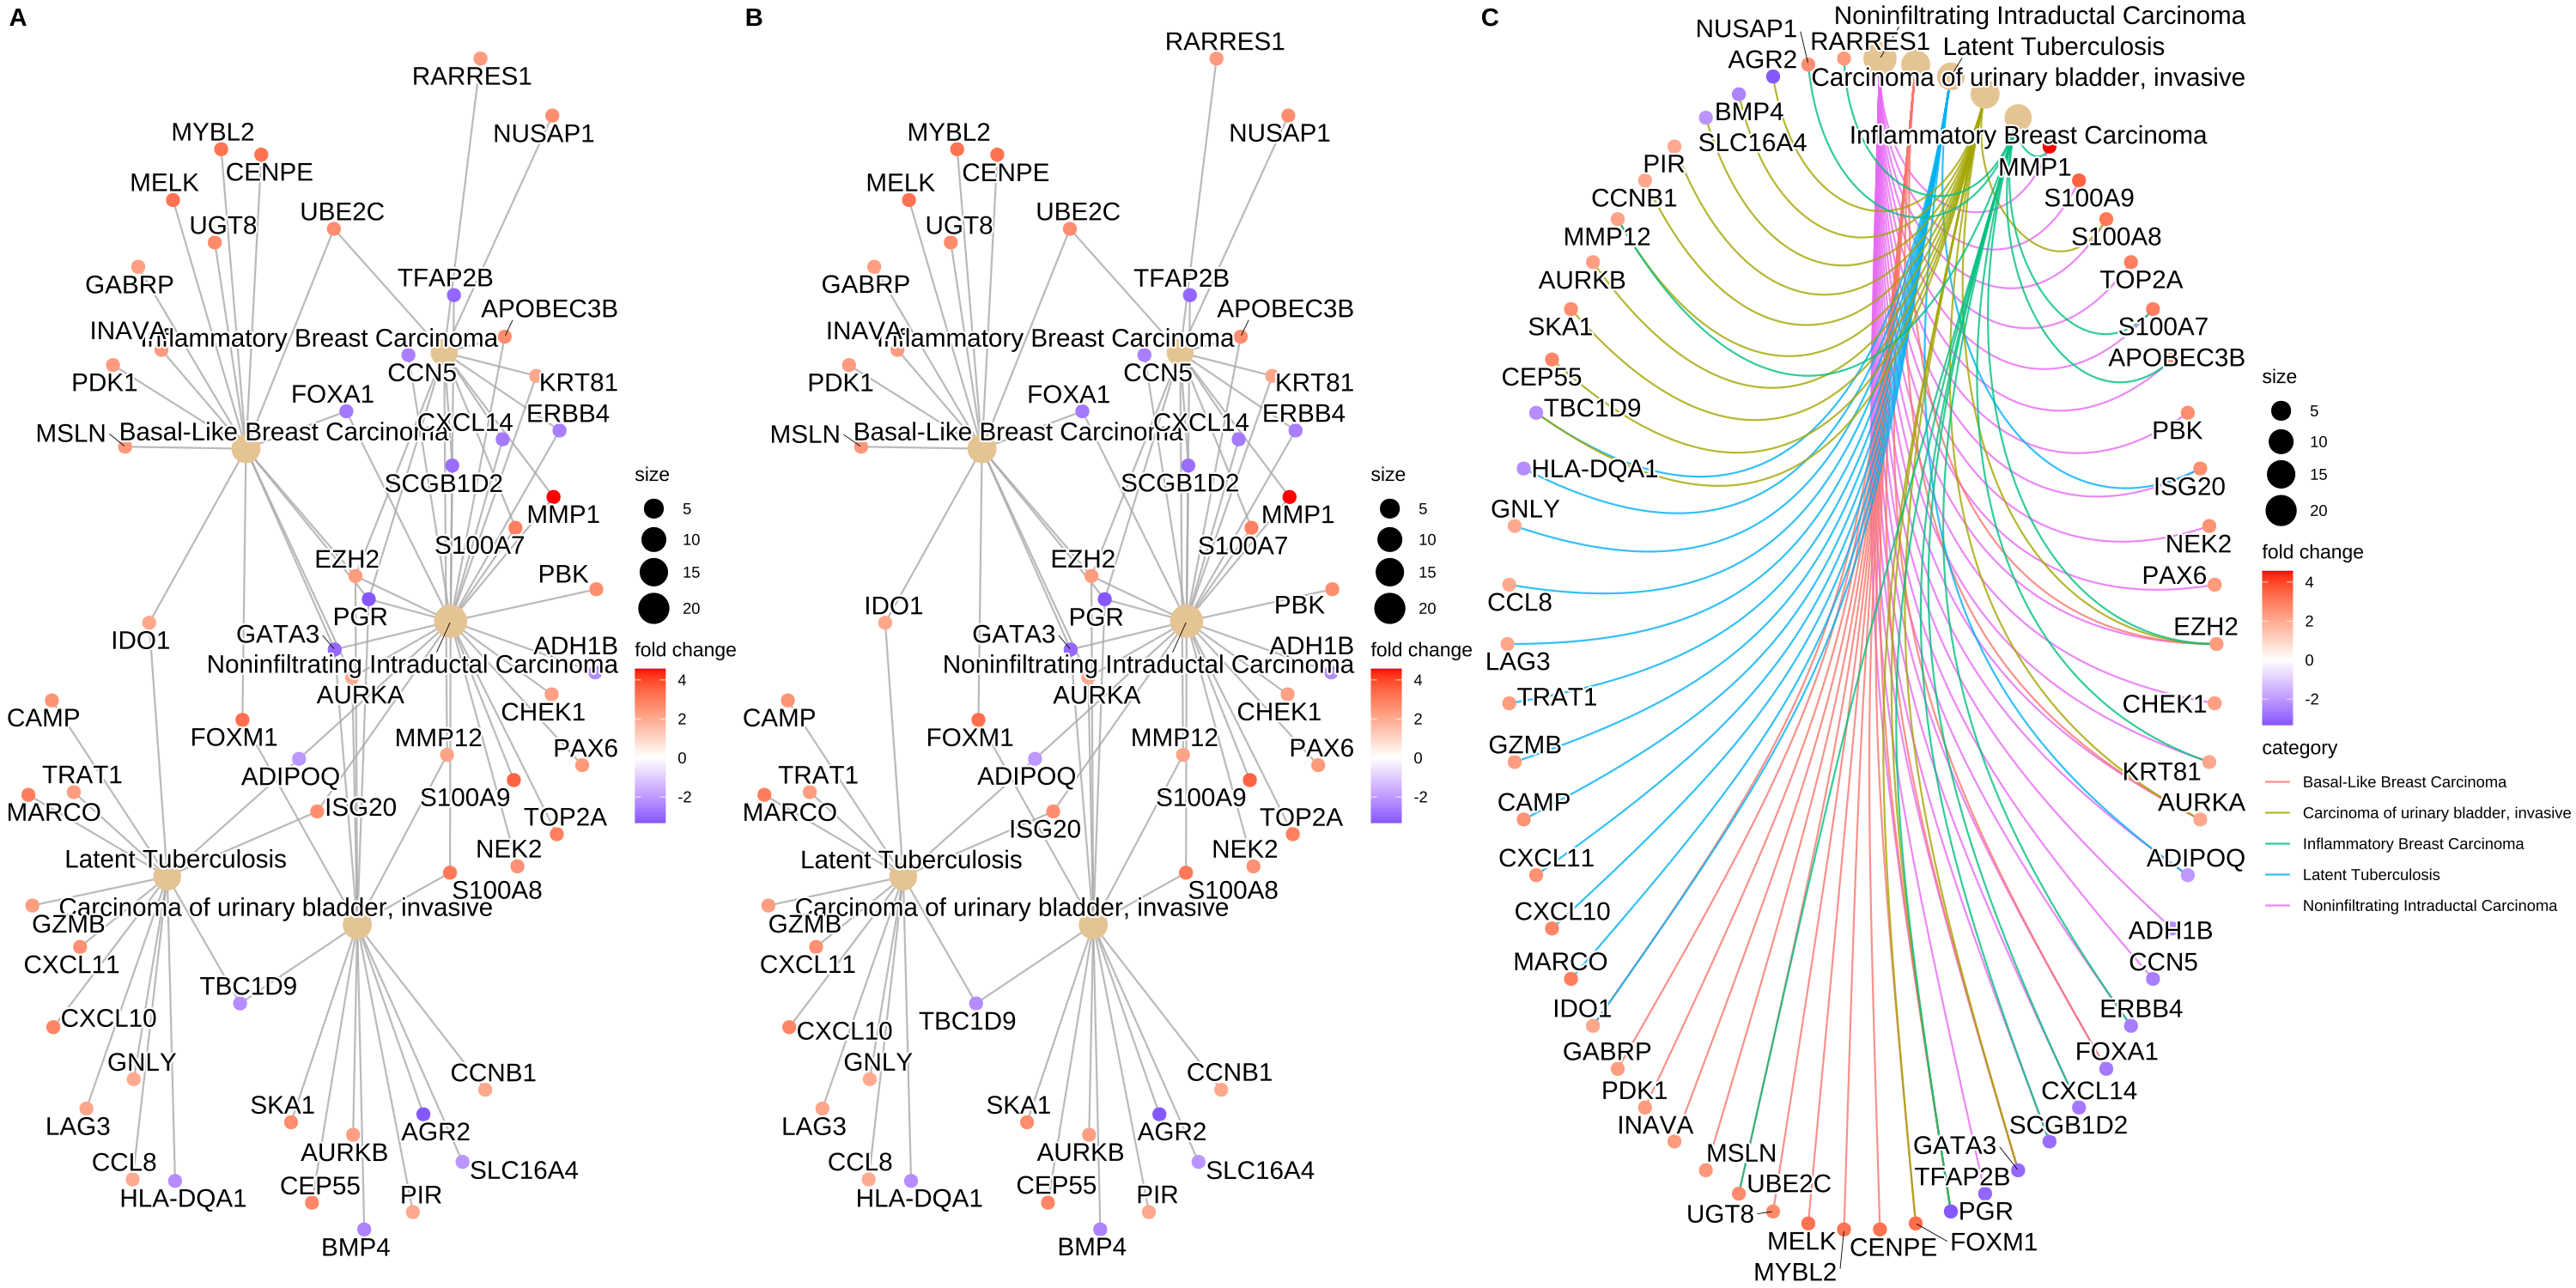
I am looking for generate a circular cnetplot like the c plot 
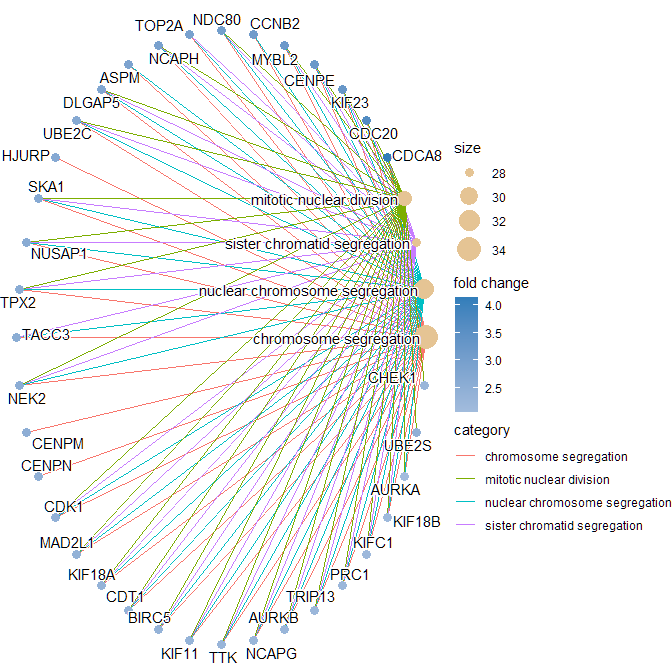
But the only thing I am able to generate are the a and b plots. It's like the "circular" isn't working, and I am not able to generate the categorie legend and the color of the edge either. I am able to put colors on the nodes with foldchange though, What I am missing ? Thank you so much for your help ! Here is my code.
````` go_enrichment <- enrichGO( gene = common_genes, OrgDb = org.Hs.eg.db, keyType = "ENTREZID", ont = "BP", pvalueCutoff = 0.05, readable = TRUE )
color.params <- list(foldChange = foldChange) # Specify fold-change for coloring
p <- cnetplot(
go_enrichment,
showCategory = 10,
circular = TRUE,
colorEdge = TRUE,
color.params = color.params,
cex.params = cex.params
)
sessionInfo( )
```


Thank you so much ! It's working !