I've used oarfish to quantify transcripts in a direct RNA-sequencing nanopore analysis.
I've then used txmeta to import the data and am using swish to perform differential gene expression with inferential replicates on our data, as per an earlier question posted here: Problems with oarfish + tximport + swish
I'm pretty happy with the results, e.g. genes I had expected to go down, go down, and genes I expected up are indeed up
gse <- summarizeToGene(k_skip, skipRanges=TRUE, tx2gene=tx2gene)

gy <- scaleInfReps(gse)

gy <- labelKeep(gy)
gy <- gy[mcols(gy)$keep,]
set.seed(42)
gy <- swish(gy, x="condition")
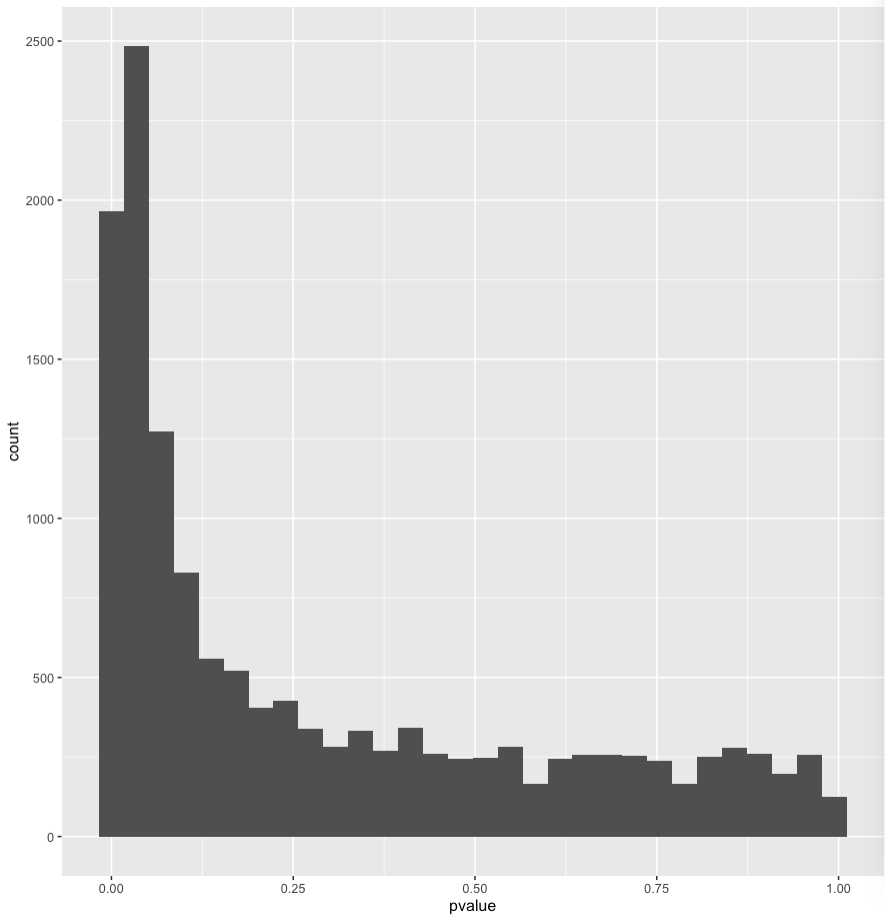
The p-value histogram looks good
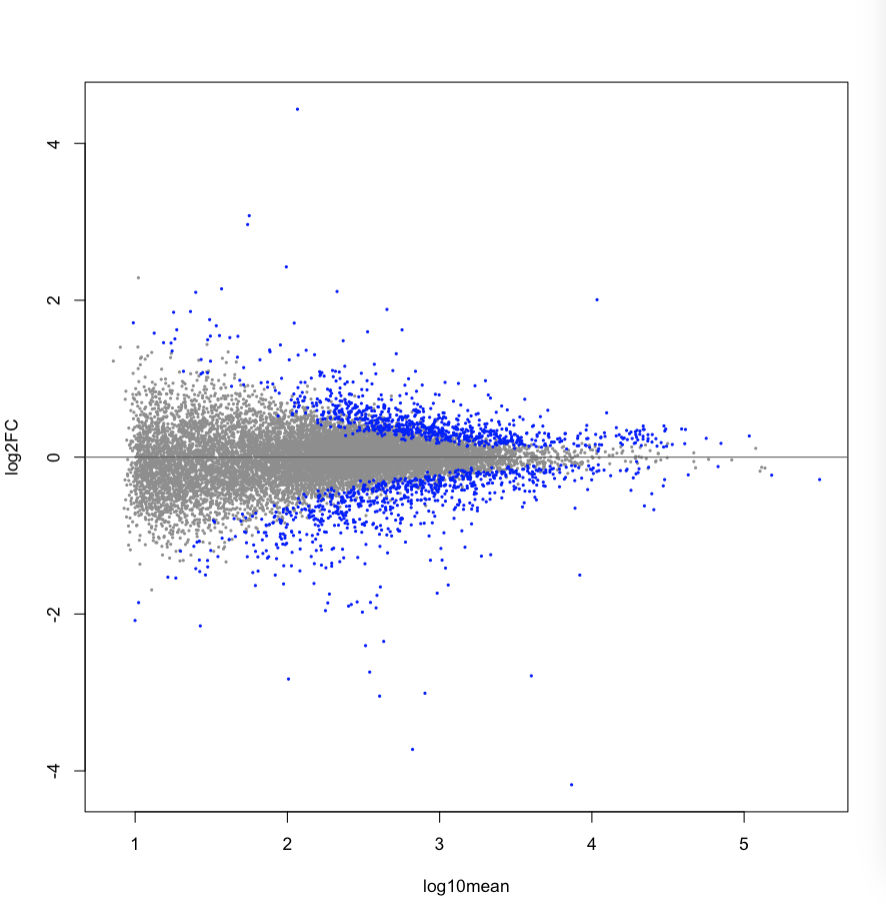
No concerns with the MA plot
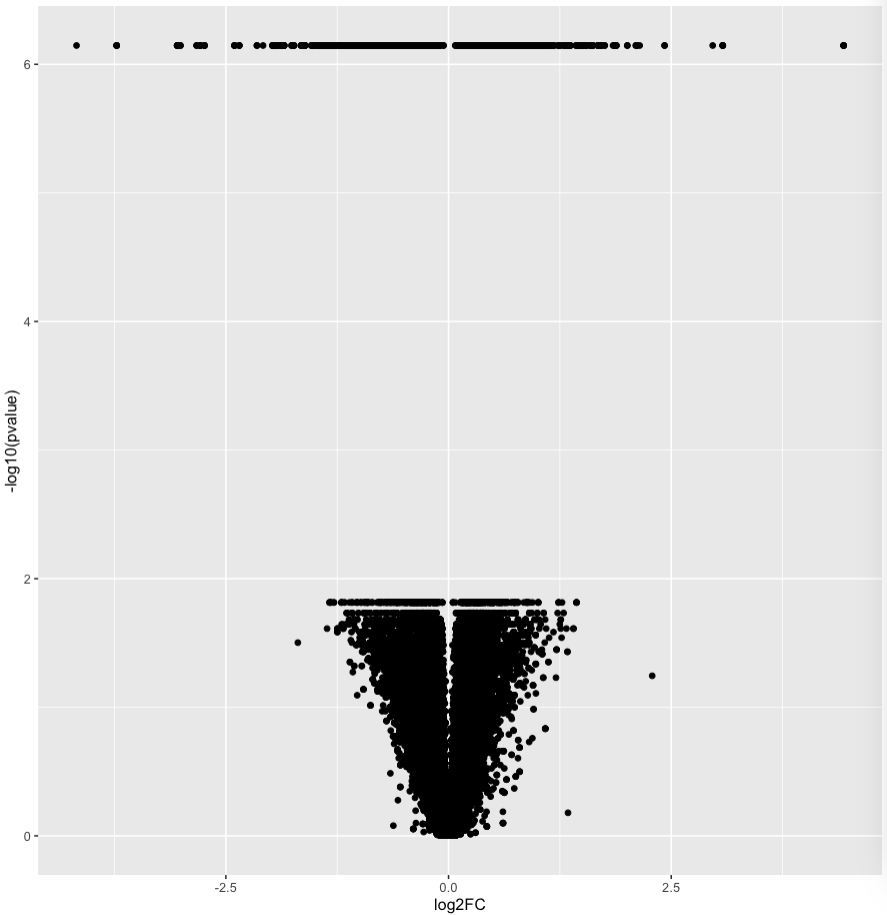
However, the volcano plot looks....curious.
My first guess is that practically infinitely small p-values have been assigned an arbitrary number - but I just wanted to affirm that this could be an expected result of the analysis?


