Hi Everyone,
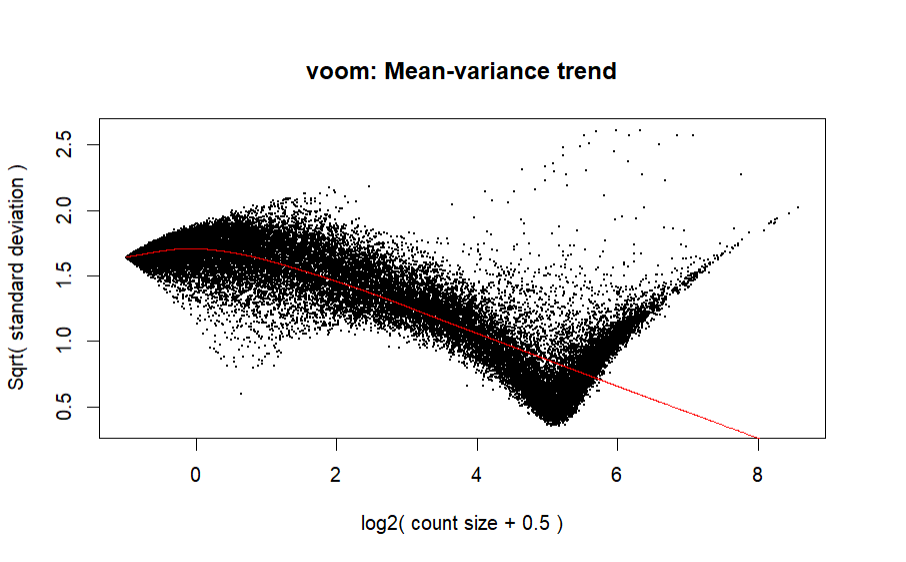
I'm having a bit of trouble with my voom normalization as the mean-varience plot looks extremely off. As reference, here is an image:
For context, my dataset is a merged dataset, here is my code for my dataset:
    pan_gene_reads$gene <- pan_gene_reads$Name
STARcounts$gene <- STARcounts$Ensembl_ID
Target_gene_exp_count$gene <- Target_gene_exp_count$sample

pan_gene_reads$gene <- gsub("\\.\\d+$", "", pan_gene_reads$gene)  # Remove version numbers
STARcounts$gene <- gsub("\\.\\d+$", "", STARcounts$gene)
Target_gene_exp_count$gene <- gsub("\\.\\d+$", "", Target_gene_exp_count$gene)

combined_data_counts <- merge(pan_gene_reads, STARcounts, by = "gene", all = FALSE)
combined_data_counts <- merge(combined_data_counts, Target_gene_exp_count, by = "gene", all = FALSE)

gene_names_counts <- combined_data_counts[,1:3]
combined_data_counts$gene
combined_data_counts <- combined_data_counts[, -c(1:3)]
combined_data_counts <- combined_data_counts[, -363]
combined_data_counts <- combined_data_counts[, -546]
And here is the code for my voom normalization:
    dge1 <- DGEList(counts = combined_data_counts)

 keep <- rowSums(cpm(dge1) > 1) >= 2
 d1 <- dge1[keep, , keep.lib.sizes = FALSE]
dim(d1)

dge1 <- calcNormFactors(dge1)

dge1$samples$norm.factors


design1 <- model.matrix(~1, data = dge1$samples)


voom_data1 <- voom(d1, design = design1, plot = TRUE)
Is this plot or code bad? If so, how can I fix it? I've tried removing batch effects, which doesn't work since voom doesn't accept negative values, and further filtering, which doesn't change the plot.


Thanks for responding! I did change the code slightly:
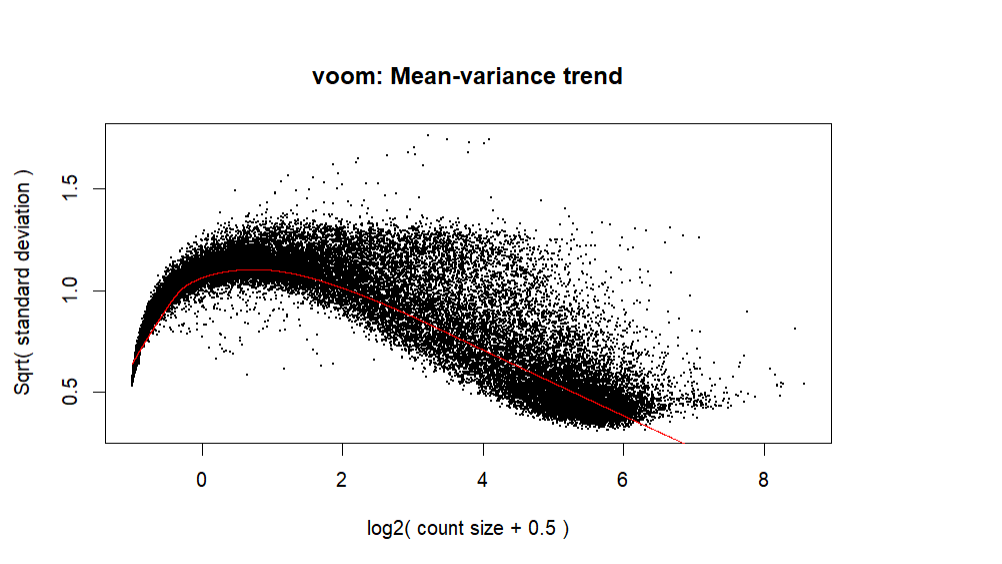
And ended up with a slightly better plot:
When I include batch variables in the design matrix, A) It doesn't change the plot B) I receive a warning saying partial NA coefficients for 52764 probes Any ideas how to fix this? Any help would be appreciated, thanks!
You will get NA coefficients from
~Group+Batchbecause the Group factor is completely confounded with the batch factor.So I changed it to ~0 + group (with the same plot), but I still don't know if it's good or what to fix if not.
It looks more as you might expect, although it doesn't appear that you are filtering many of the low expressing genes out. Normally you should expect some truncation of the genes with a logCPM < 1 or so.