Entering edit mode
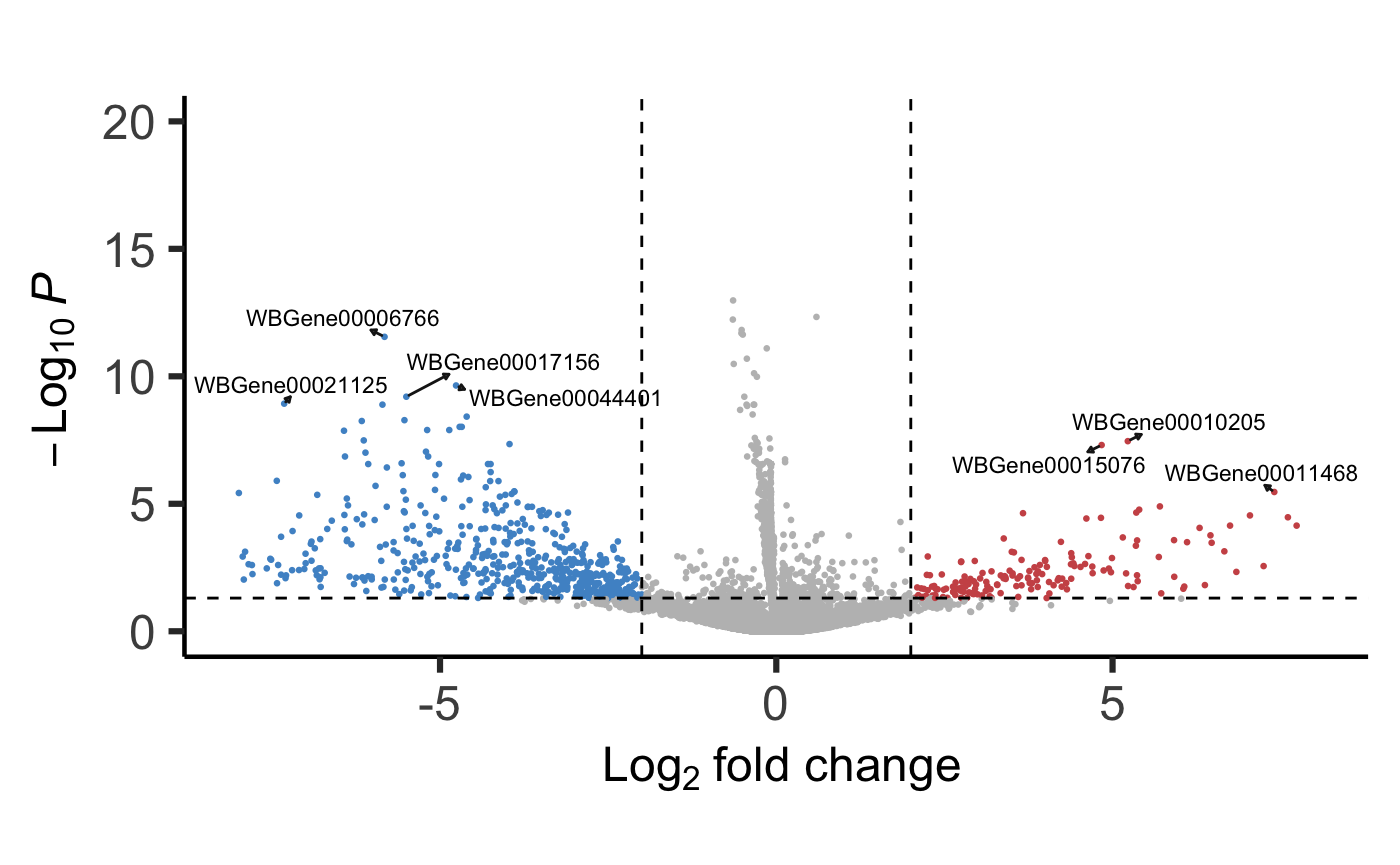
I performed differential expression analysis using DESeq2, using lfcShrink (apeglm). My volcano plot looks really strange with a lot of values around zero...
I'm not sure what this means, would anybody would be able to explain why this might be the case?
Thank you in advance.


Thank you. Could you clarify what that says about the validity of the whole dataset? Would it still be alright to assess candidates above the thresholds, for example the blue and red values?
And if not, would appreciate any suggestions on how to change my analysis parameters to prevent this from happening. Thanks in advance
I don't think this is evidence that the dataset is invalid. It's evidence that your experiment is underpowered, and/or your experimental condition has a very small effect.
Changing parameters won't magically change those factors.
Why this cluster close to 0 with low p value is so distinctive. Is this common? What does it mean and why? Thanks