Entering edit mode

Hello! I am looking for DE genes comparing condition1 vs control. I have 3 biological replicates per each case, so 6 in total. I am using this design:
design=~ sex + condition
and I am filtering low expressed genes in this way:
smallestGroupSize <- 3
keep <- rowSums(counts(dds0) >= 10) >= smallestGroupSize
Then I get my DE that looks like this, with lfc=+/-1.5 and padj<0.005
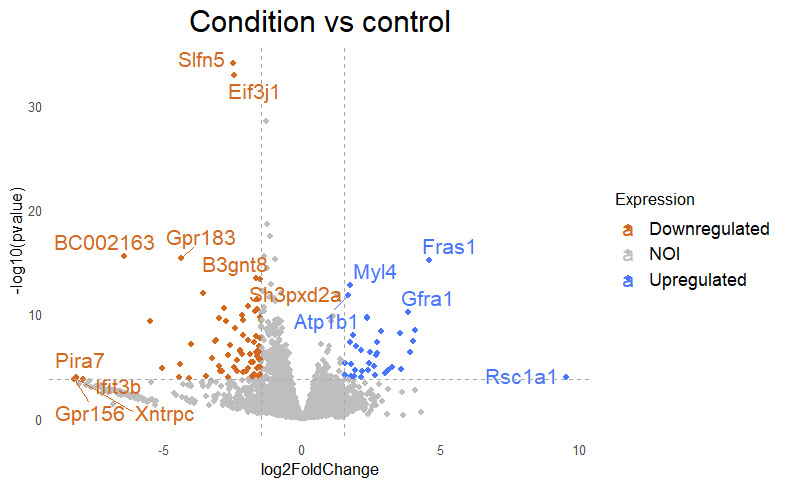
But when i then look at raw counts and tpm of Slfn5 looks like this:
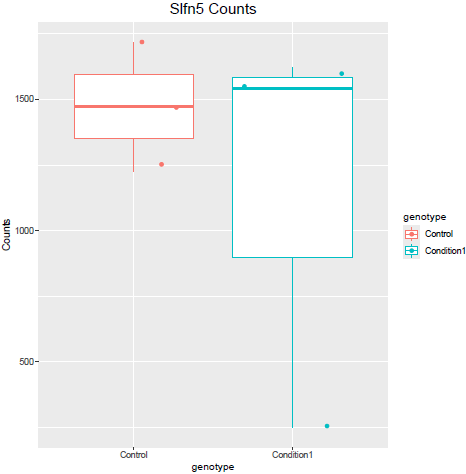
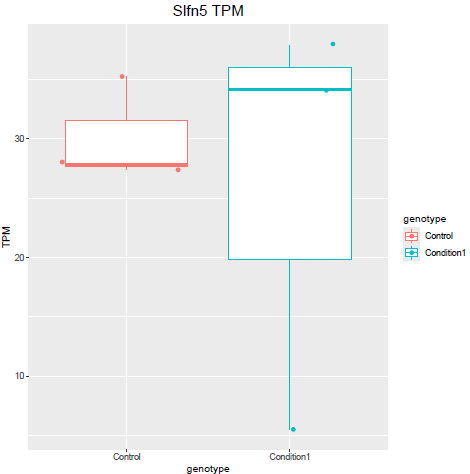
Why do I get this high padjusted value for this gene?


Hello Michael, thanks for your answer. Yes, I have only 3 samples :(. Dropping sex would remove those genes but at the same time does not include other DE genes. For example: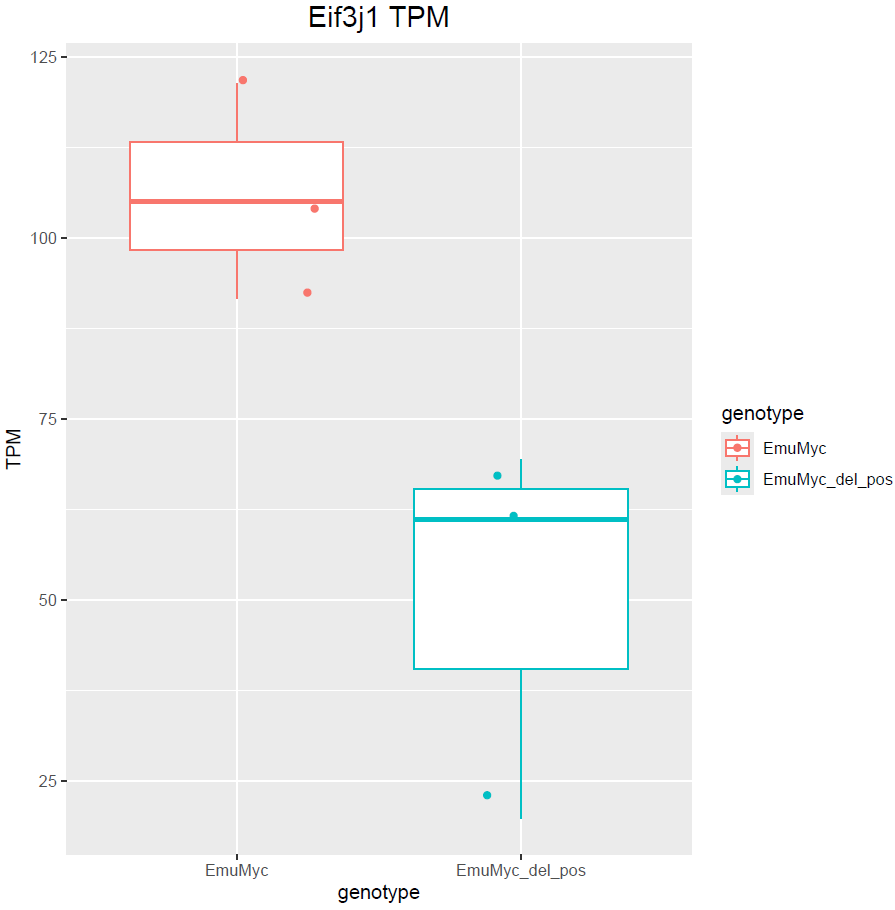 is not included. This is also valid the other way around with
design=~genotype. I was wondering if could be a possibility to use a more stringent filtering based on condition and variance for the multivariate model, what do you think?TPM is not a robust scaling method and can be influenced by changes in global distribution.
What do you get with an MA plot. Can you highlight these genes in an MA plot?
Also how about a box plot of log (raw) counts eg
boxplot(log10(counts(dds)+1))
These are the MA plot for design=~sex+genotype and boxplots with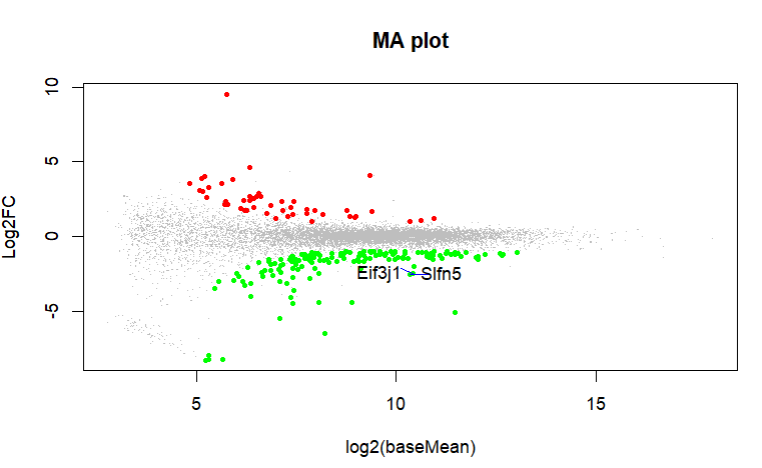
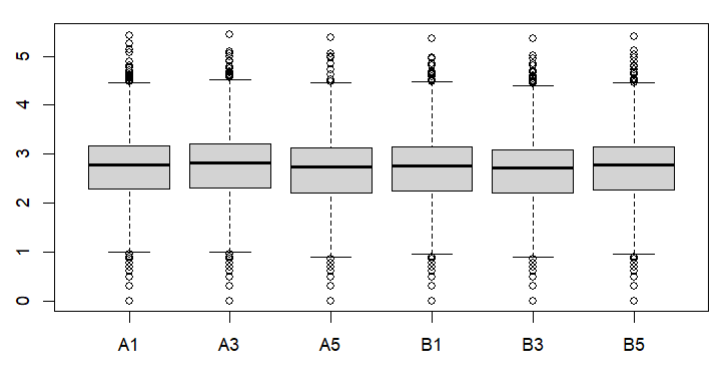
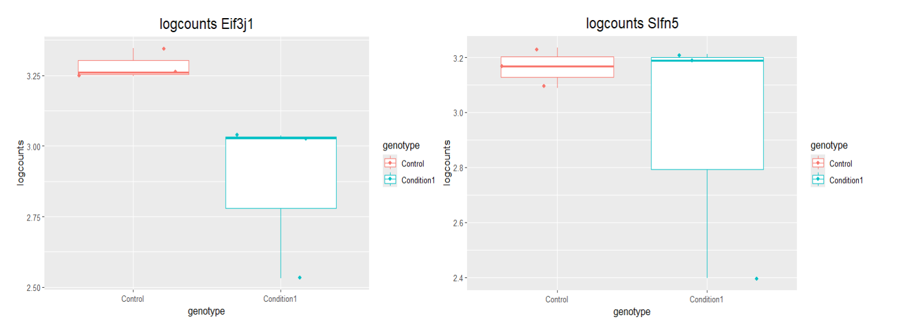
boxplot(log10(counts(dds)+1))Eif3j1 is a hard case, although there is separation here, there is also substantial spread. The posterior LFC is probably not that large?
lfcShrink()?The lfc of Eif3j1 is around -2.5, i tried with and without shrinkage but didn't change for those genes. What about Slfn5?
These are both hard to call for me, looking at the plots. It ends up depending on the information sharing from the rest of the genes, and the design. I'm not sure 6 is enough to really control for sex and genotype, so you end up a bit overfitting in that design. I would tend to use either
lfcShrinkorlfcThresholdto prioritize genes.Thanks for the suggestions. I simplified the model to design=~genotype. I tried both with and without lfcshrinkage and I am not finding anymore genes with high padj but no clear separation :) The problem is that I find significative genes only lowering padj to 0.5 and lfc to 1 and I don´t know if this can be accepted :| Setting lfcThreshold I don´t find any DE gene (with threshold 0.5)
This last problem, I don't know how to help with, I think there's high variability here and not many degrees of freedom to overcome that