Hello,
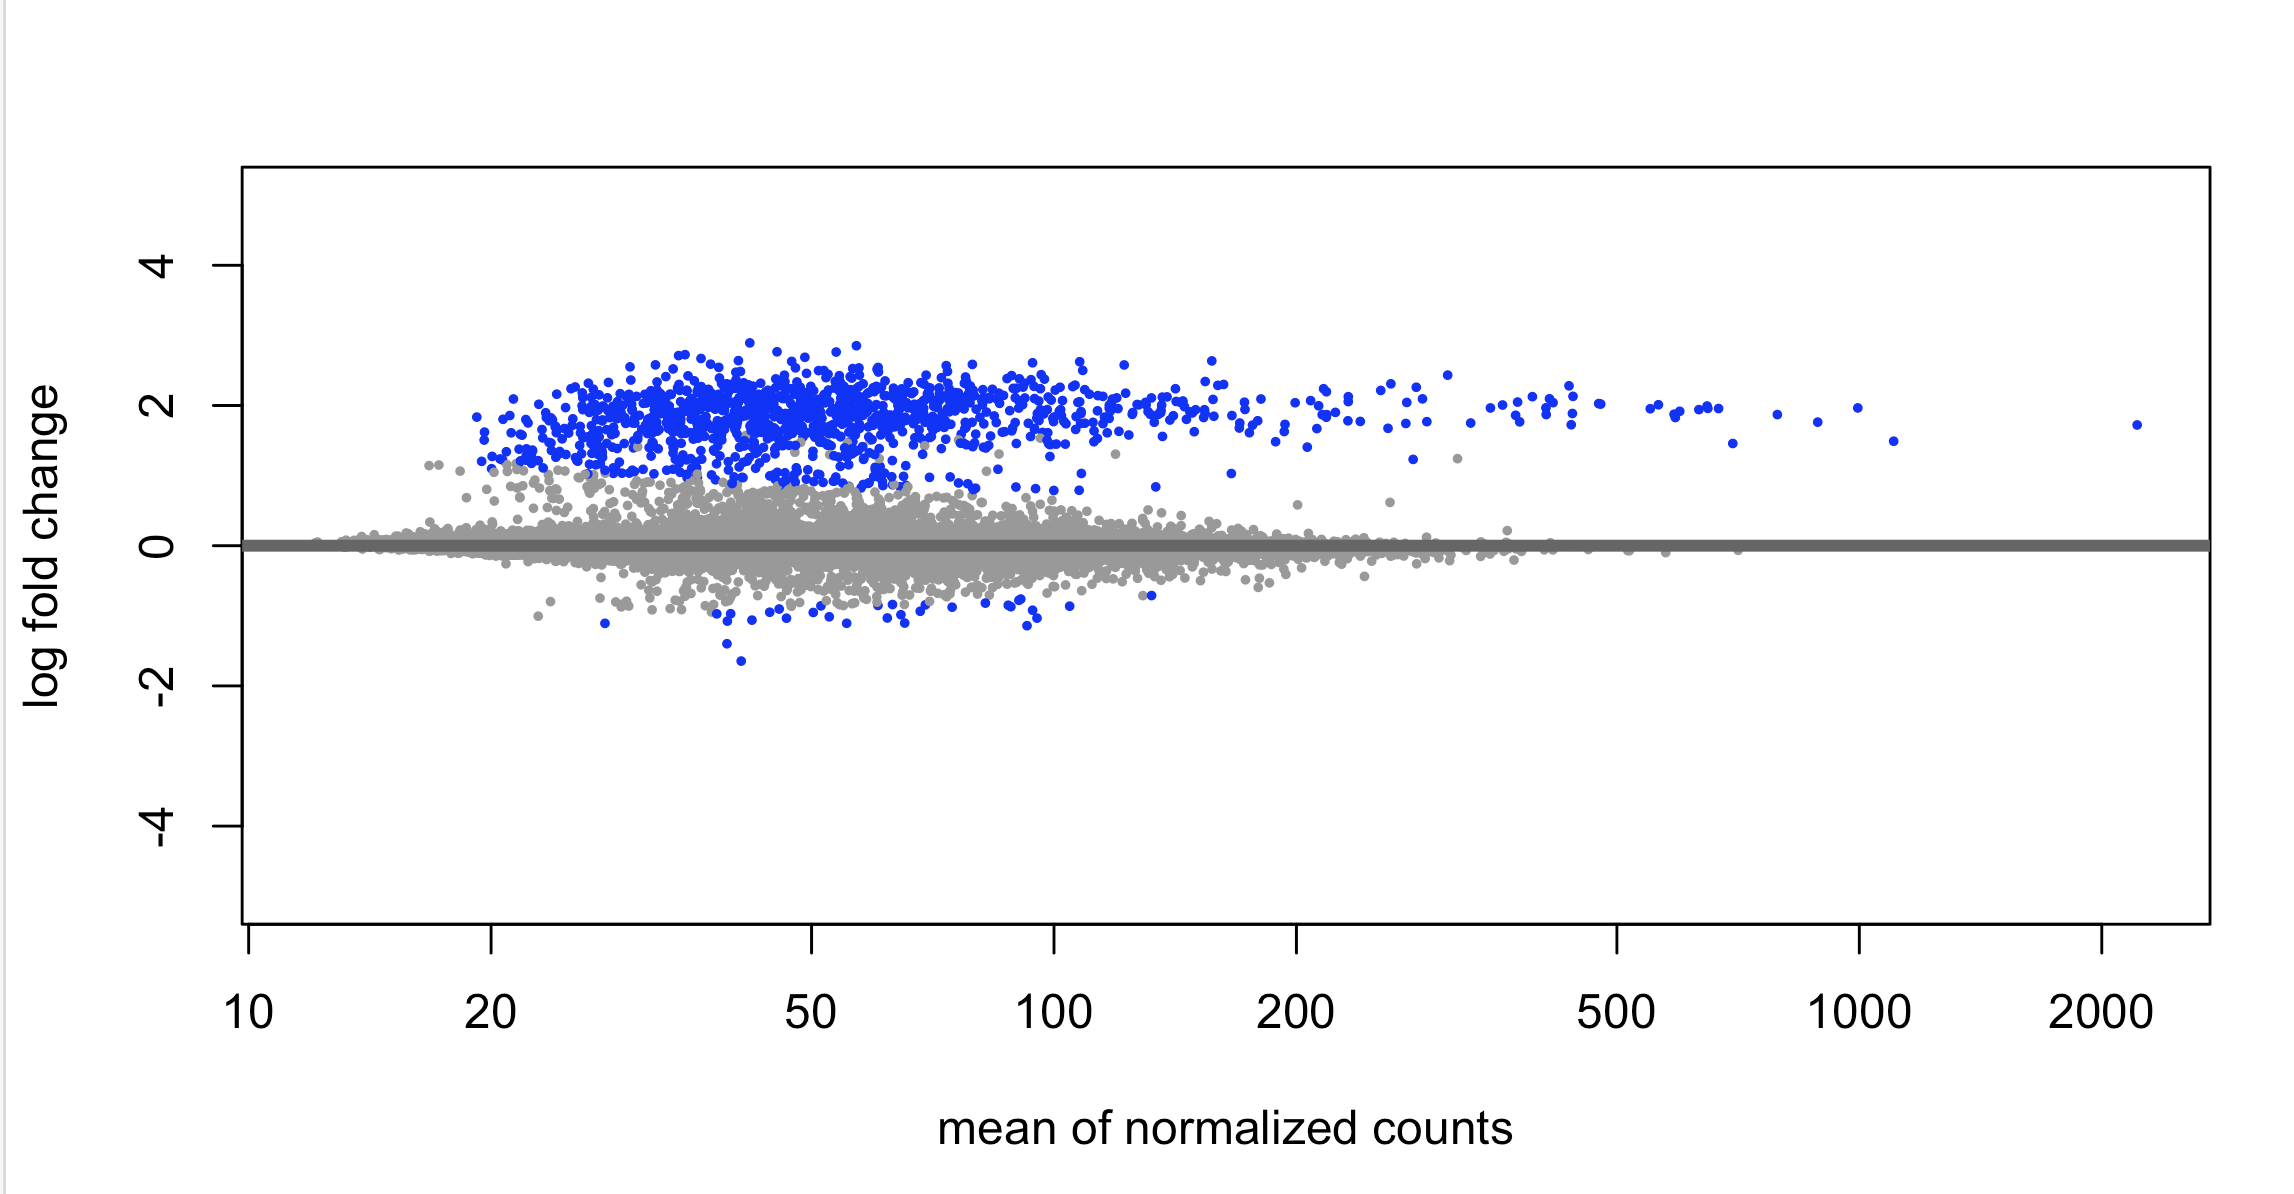
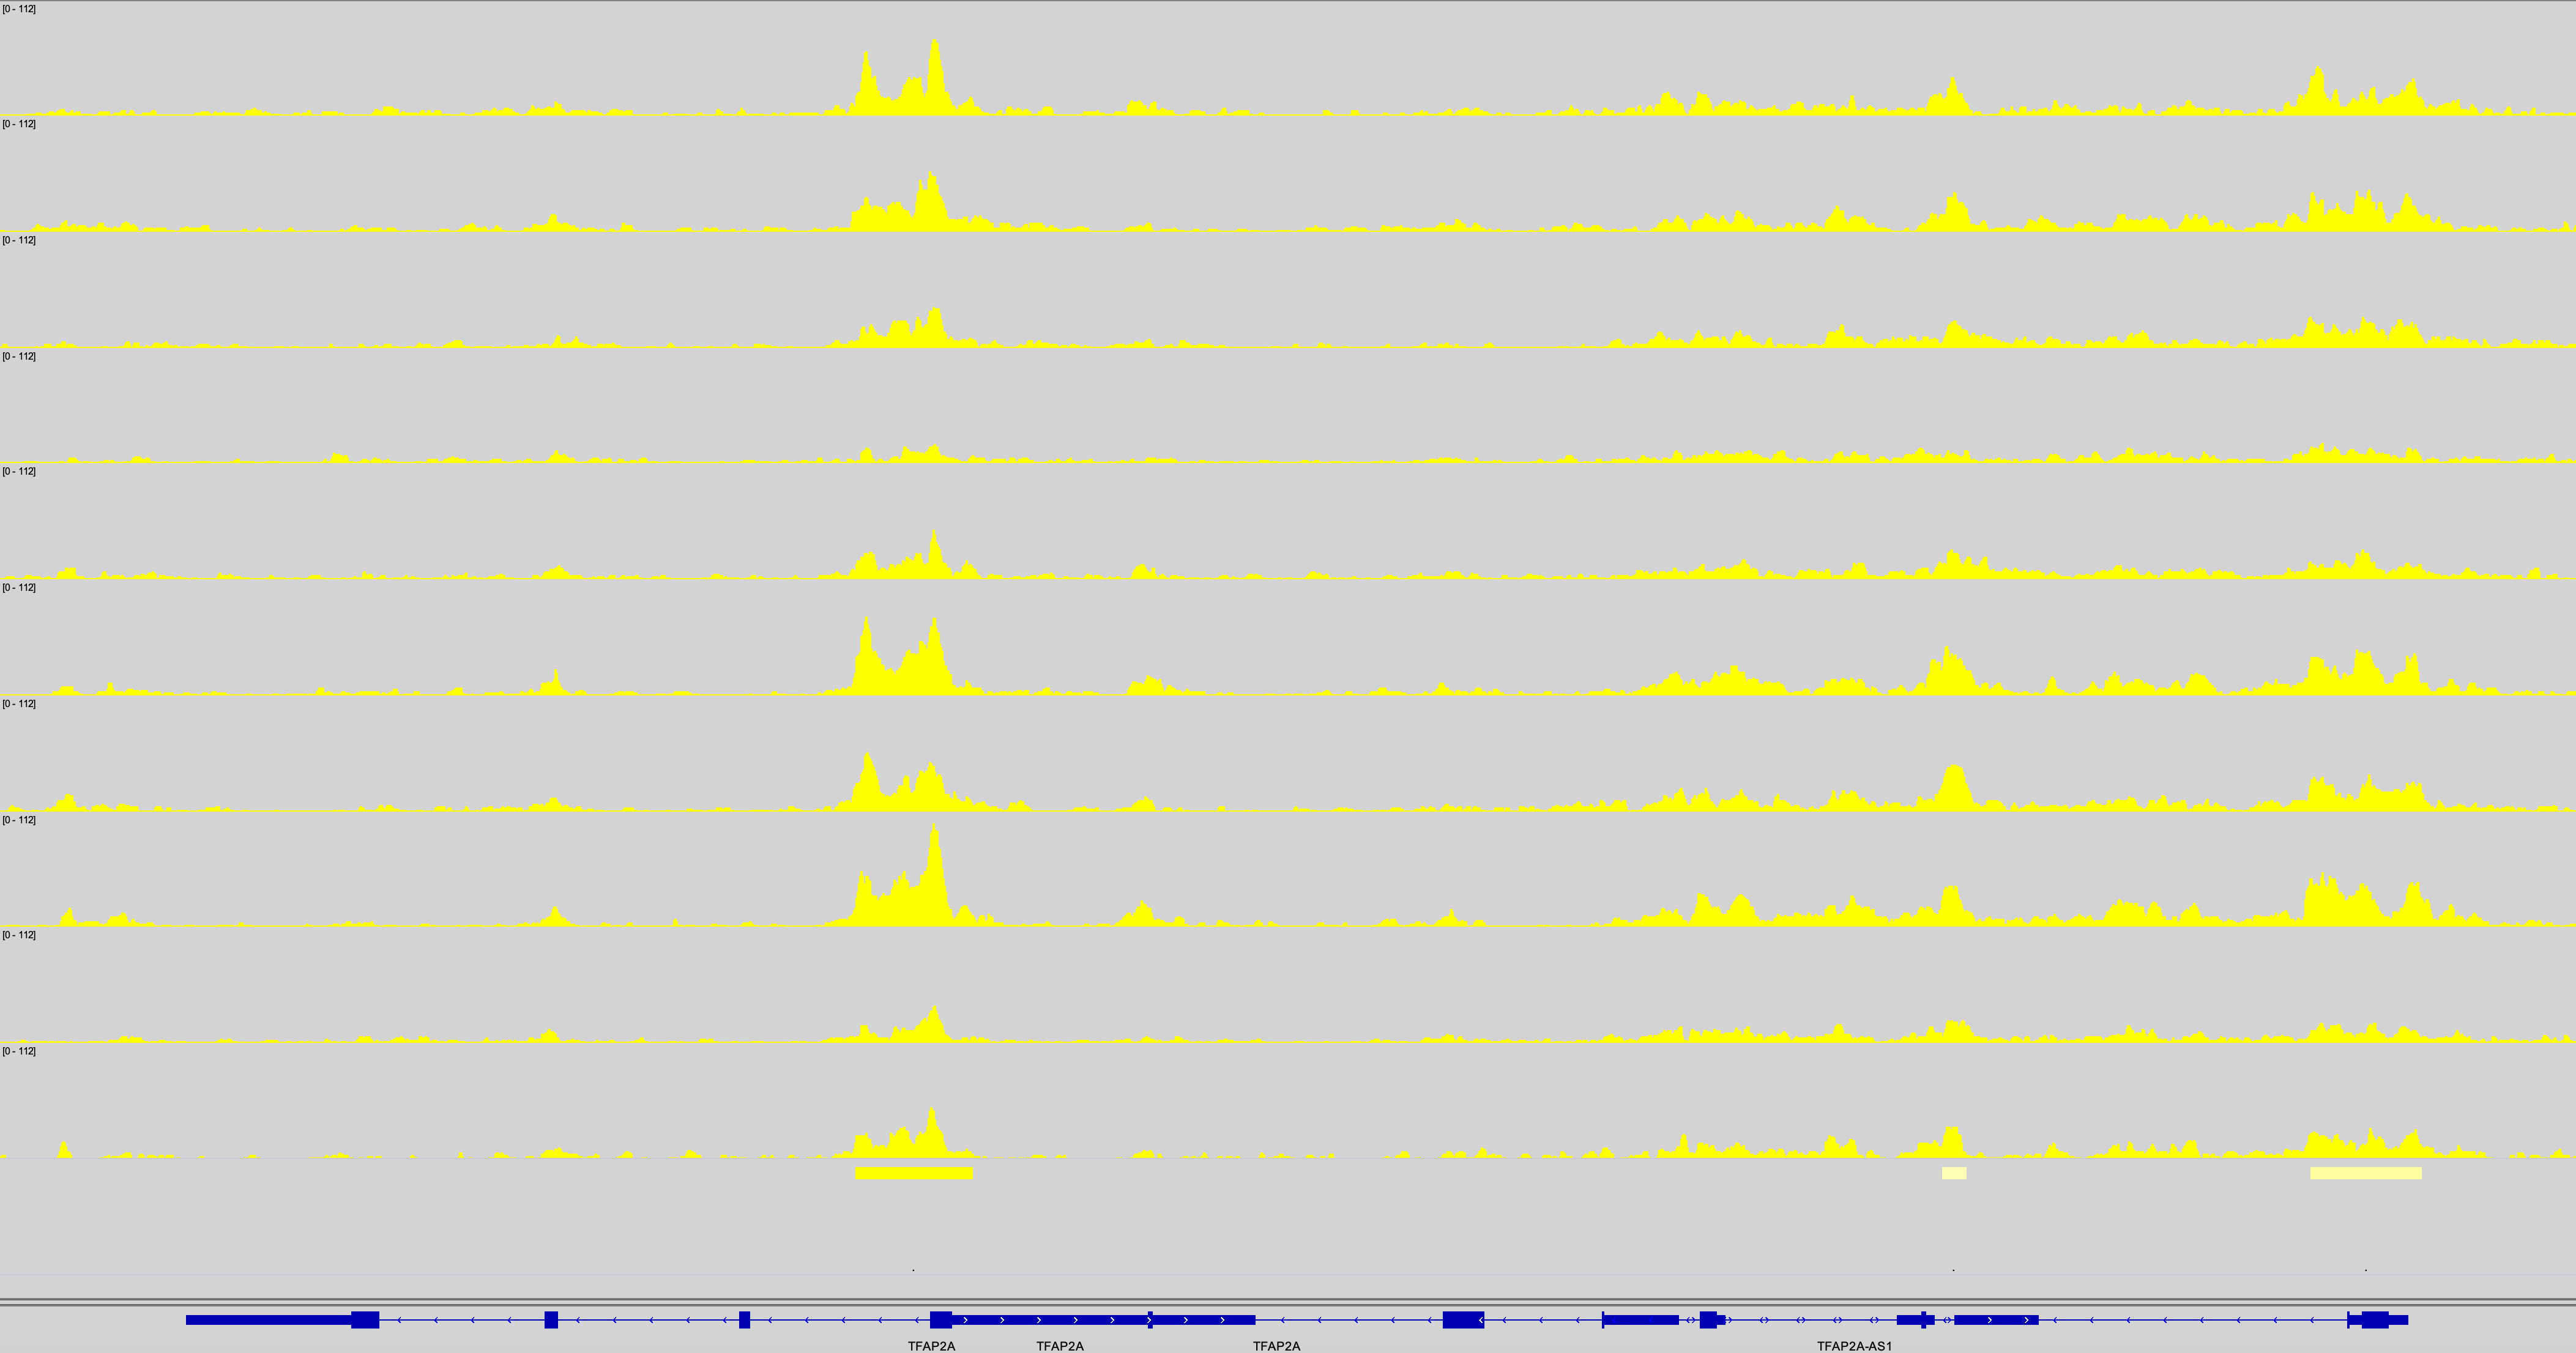
Looking for peace of mind really. We routinely perform bulk ATAC across multiple primary human cell types (fibros, immune cells). We recently did bulk ATAC-seq on human mammary epithelial cells and performed differential analysis with DESeq2. The design is 2 biological replicates of a 5 time-point time series. The counting step was done with summarizeOverlaps against an IDR-cleaned list of MACS3-detected peaks. We then contrasted each time point relative to the reference at Day 0. I have never seen this before, but DESeq2 only found mostly peaks with increased counts at one time point (Day 7), with close to 0 peaks with reduced counts. I have never seen such an unbalanced distribution (see MA plot and heatmap attached) 


Cheers for any insight,
# include your problematic code here with any corresponding output
# please also include the results of running the following in an R session

sessionInfo( )

 We will try adding two more replicates see if things get better.
It is hard to comment here. My suggestion is:
results()