DEseq 2 LFC shrinkage with apeglm in single-cell pseudobulk: strange volcano plot results
1
0
Entering edit mode
picasa1983 • 0
@picasa1983-14806
Last seen 2 hours ago
USA

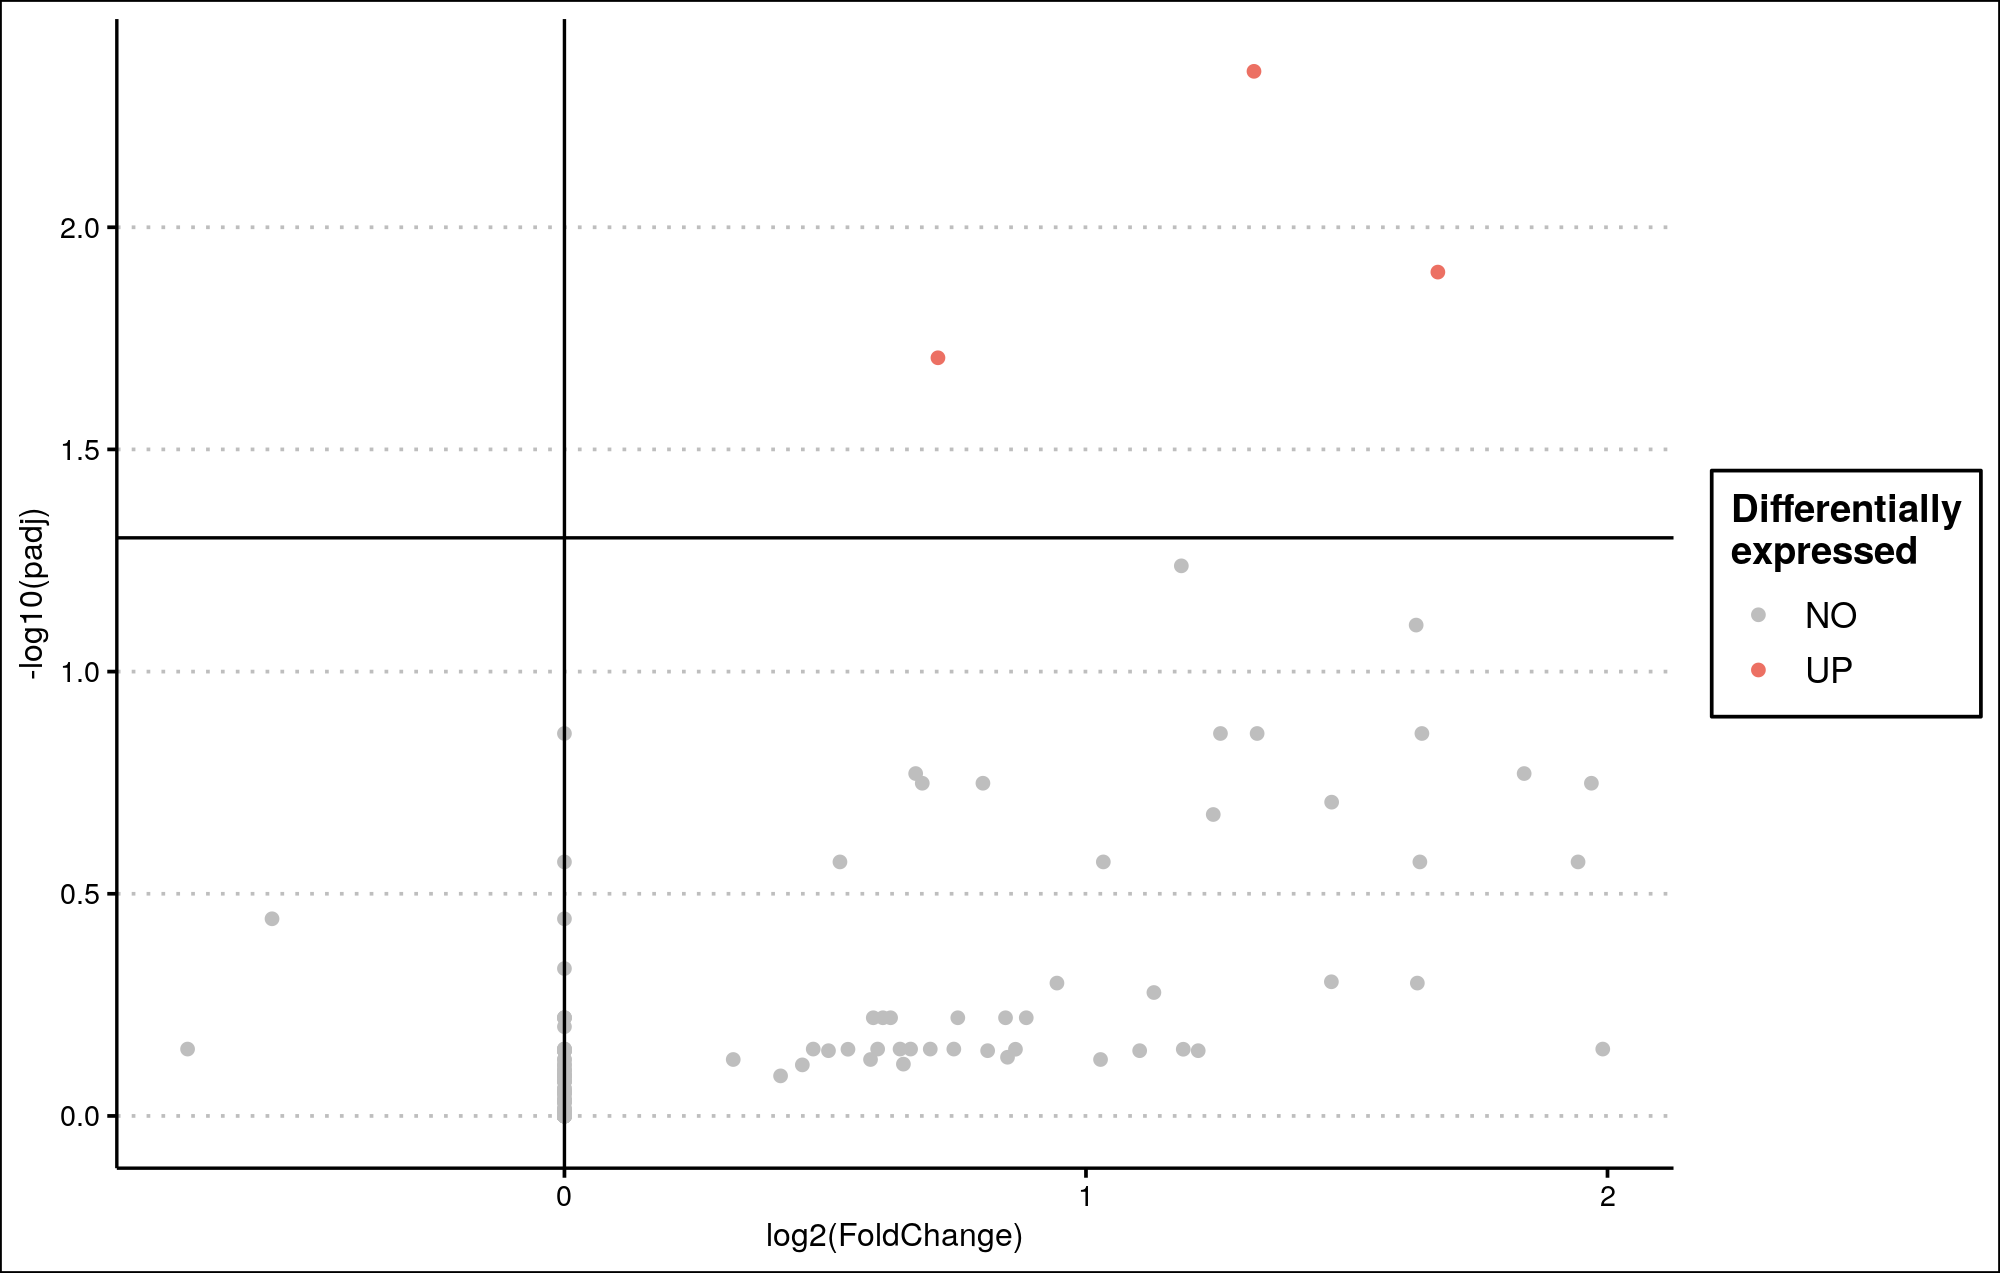
I generated a volcano plot using DESeq2 for a single-cell study transformed into pseudobulk. I am applying log fold change shrinkage using the apeglm method.

However, the resulting plot looks unusual. It does not resemble a typical volcano plot, and many genes have an LFC of 0, yet show varying adjusted p-values (padj).

Are there specific parameters I should adjust when analyzing pseudobulk transformed counts from single-cell RNA-seq?

enter image description here

DESeq2 • 39 views
ADD COMMENT
0
Entering edit mode
ATpoint ★ 4.4k
@atpoint-13662
Last seen 3 hours ago
Germany

There is nothing unusual here. There is simply no evidence for differential expression. Almost all genes are shrunken towards zero, due to the lack of evidence.

Check data by PCA if unwanted variation/ batch effects are present.

ADD COMMENT

Login before adding your answer.

Traffic: 577 users visited in the last hour
Help About
FAQ
Access RSS
API
Stats

Use of this site constitutes acceptance of our User Agreement and Privacy Policy.

Powered by the version 2.3.6