
Hi everyone,
I'm currently working with NanoStringGeoMXSet objects in R and have successfully performed deconvolution using runspatialdecon(), followed by reverse deconvolution with runReverseDecon(). Now, I'm looking to generate boxplots (or barplot) to compare ABL1 gene expression between different groups (e.g., "Group A" vs. "Group B"), stratified by CellType using the resulting reverse deconvolution dataframe.
Here's the full code I've used, based on the SpatialDecon vignette:
# Load necessary libraries
library(SpatialDecon)
library(GeomxTools)

# Load sample data and update the GeoMxSet object
data("nsclc")
nsclc <- updateGeoMxSet(nsclc)

# Assign more readable segment names
sampleNames(nsclc) <- paste0(nsclc$ROI, nsclc$AOI.name)

# Set feature type to "Target"
featureType(nsclc) <- "Target"

# Derive background data from normalized expression data
bg <- derive_GeoMx_background(norm = nsclc@assayData$exprs_norm,
                               probepool = fData(nsclc)$Module,
                               negnames = c("NegProbe-CTP01", "NegProbe-Kilo"))

# Load safeTME dataset
data("safeTME")

# Download mouse spleen profile matrix (for profiling comparison)
mousespleen <- download_profile_matrix(species = "Mouse",
                                       age_group = "Adult",
                                       matrixname = "Spleen_MCA")

# Create a custom profile matrix from a single-cell dataset
data("mini_singleCell_dataset")
custom_mtx <- create_profile_matrix(mtx = mini_singleCell_dataset$mtx,
                                    cellAnnots = mini_singleCell_dataset$annots,
                                    cellTypeCol = "LabeledCellType",
                                    cellNameCol = "CellID",
                                    matrixName = "custom_mini_colon",
                                    normalize = FALSE,
                                    minCellNum = 5,
                                    minGenes = 10,
                                    scalingFactor = 5,
                                    discardCellTypes = TRUE)

# Generate a random grouping variable
set.seed(101)
pData(nsclc)$MyGroupingVar <- sample(c("Group A", "Group B"),
                                     replace = TRUE, size = nrow(pData(nsclc)))

# Run spatial deconvolution
res <- runspatialdecon(object = nsclc,
                       norm_elt = "exprs_norm",
                       raw_elt = "exprs",
                       X = safeTME,
                       align_genes = TRUE)

# Run reverse deconvolution
rdecon <- runReverseDecon(object = nsclc,
                          norm_elt = "exprs_norm",
                          beta = res$beta)
Current Challenge:
I would like to generate boxplots that compare ABL1 expression levels between Group A and Group B for each CellType derived from the reverse deconvolution results.
Can someone suggest how to operate on rdecon object:
- Extract the ABL1 expression data for each CellType.
- Plot a boxplot of ABL1 expression across Group A and Group B.
My Workaround (as of September 20, 2024):
After some experimentation, I came up with a loop that runs both runspatialdecon() and runReverseDecon() for each combination of group and segment. Here's the code I used:
#######################################################
#
# runspatialdecon and runReverseDecon Loop
#
#######################################################
df <- data.frame()
MyId <- unique(nsclc@phenoData@data$AOI.name)
MyGroup <- unique(nsclc@phenoData@data$MyGroupingVar)
for (i in MyId) {
for (g in MyGroup) {
foo <- pData(nsclc)$AOI.name == i & pData(nsclc)$MyGroupingVar == g
# Run spatial deconvolution
message("runspatialdecon:", i," ", g)
res <- runspatialdecon(object = nsclc[, foo],
norm_elt = "exprs_norm",
raw_elt = "exprs",
X = safeTME,
align_genes = TRUE)
cat("runspatialdecon: DONE.\n")
# Run reverse deconvolution
message("runReverseDecon:", i, " ", g)
rdecon <- runReverseDecon(object = nsclc[, foo],
norm_elt = "exprs_norm",
beta = res$beta)
cat("runReverseDecon: DONE.\n\n")
x <- t(rdecon@featureData@data$coefs)
x <- x[, "ABL1"]
tmp <- data.frame("ABL1" = x)
tmp$Tumor <- i
tmp$Group <- g
tmp$CellType <- rownames(tmp)
df <- rbind(df, tmp)
}
}
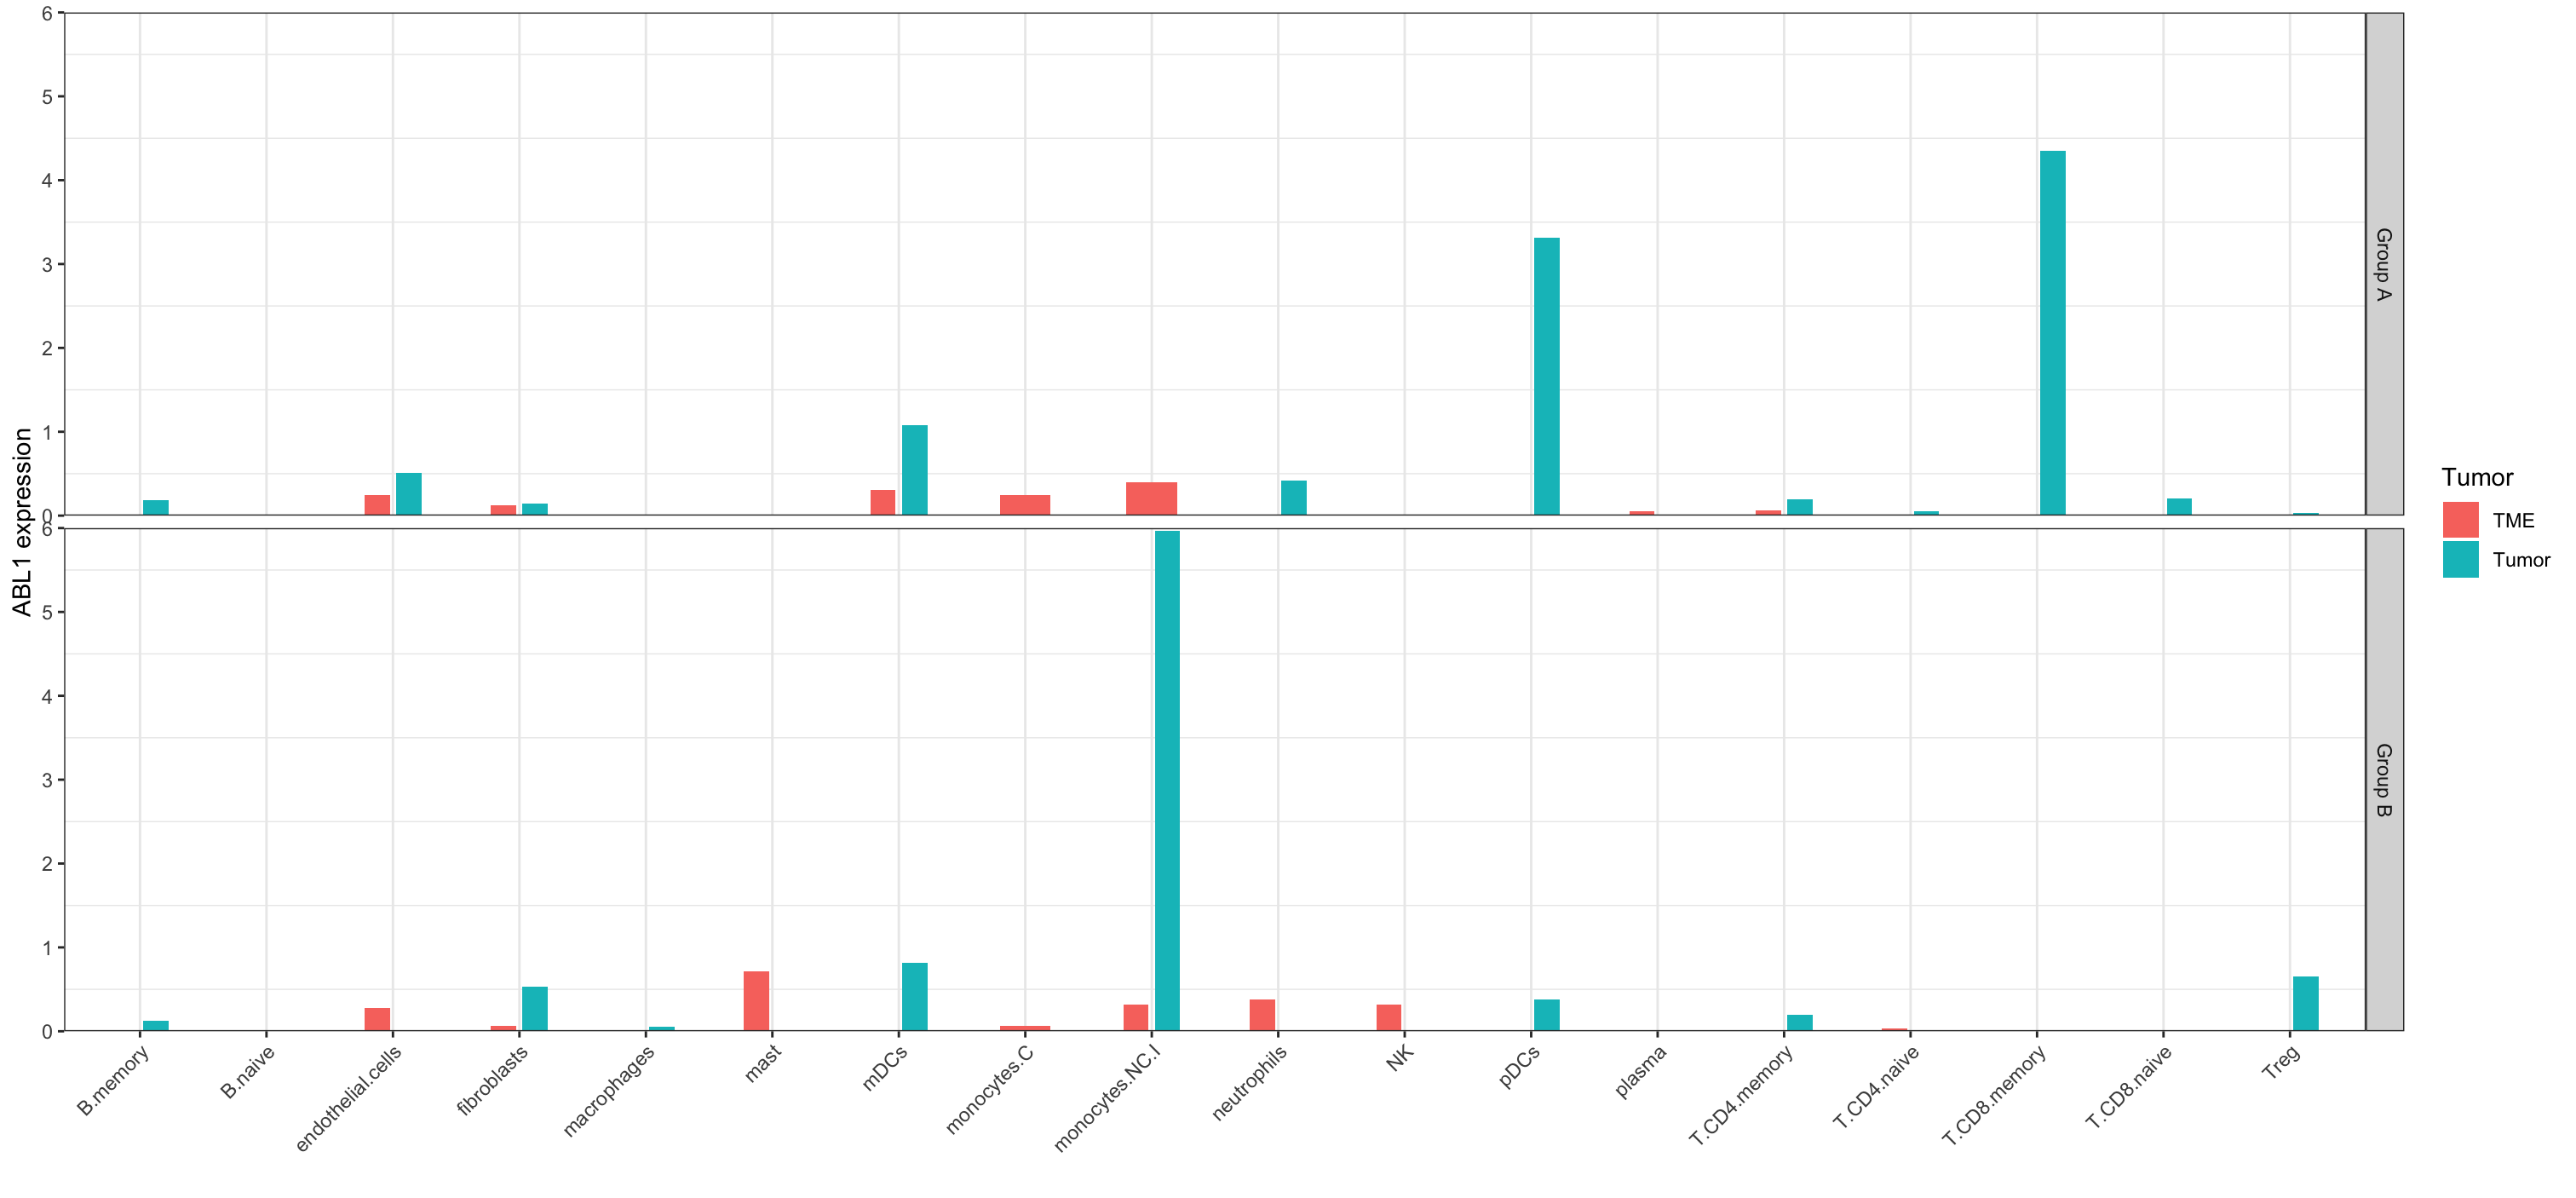
# Plotting the results
library(ggplot2)
set.seed(101)
ggplot(data = subset(df, CellType!= "(Intercept)"), aes(x = CellType, y = ABL1, fill = Tumor, ))+
geom_bar(stat = "identity", width = 0.4, position=position_dodge(width = 0.5))+
scale_y_continuous(limits = c(0, 6), expand = c(0,0))+
labs(x="", y="ABL1 expression")+
facet_grid(Group ~.)+
theme_bw()+
theme(panel.grid.major.y = element_blank(),
axis.text.x = element_text(angle = 45, hjust = 1))
Here the resulting plot:
Questions:
- Is this workaround correct for comparing ABL1 expression across groups and cell types?
- Since I don't have standard deviation (SD) or standard error (SE) values, I can't perform any statistical tests. How can I compute SD or SE?
- I tried running
runspatialdecon()by "Sample_ID" instead of grouping, but it failed due to a length mismatch (length = 1). How can I resolve this issue?
Any suggestions or insights would be greatly appreciated! Thank you.