When doing differential methylation using the sesame package, seems to only go one way
2
0
Entering edit mode
@ramirobarrantes-7796
Last seen 4 hours ago
United States

I am using the package sesame to do a differential methylation analysis on a set of tumors with and without a particular condition.

se <- SummarizedExperiment(betas, colData = metaData)
colData(se)$condition <- relevel(factor(colData(se)$EBV), "Positive")
summary = DML(se, ~condition, BPPARAM = BiocParallel::MulticoreParam(4))
test_result = summaryExtractTest(summary)

and then I test for gene enrichment:

df <- testResult[testResult$Pval_Condition < 0.01 & testResult$Eff_Condition > 0.1,]
result <- testEnrichment(df$Probe_ID, KYCG_buildGeneDBs(df$Probe_ID, max_distance=100000, platform="EPIC"),platform="EPIC")

but I get a volcano plot like this:

KYCG_plotVolcano(results,label_by="gene_name",alpha=0.01)

enter image description here

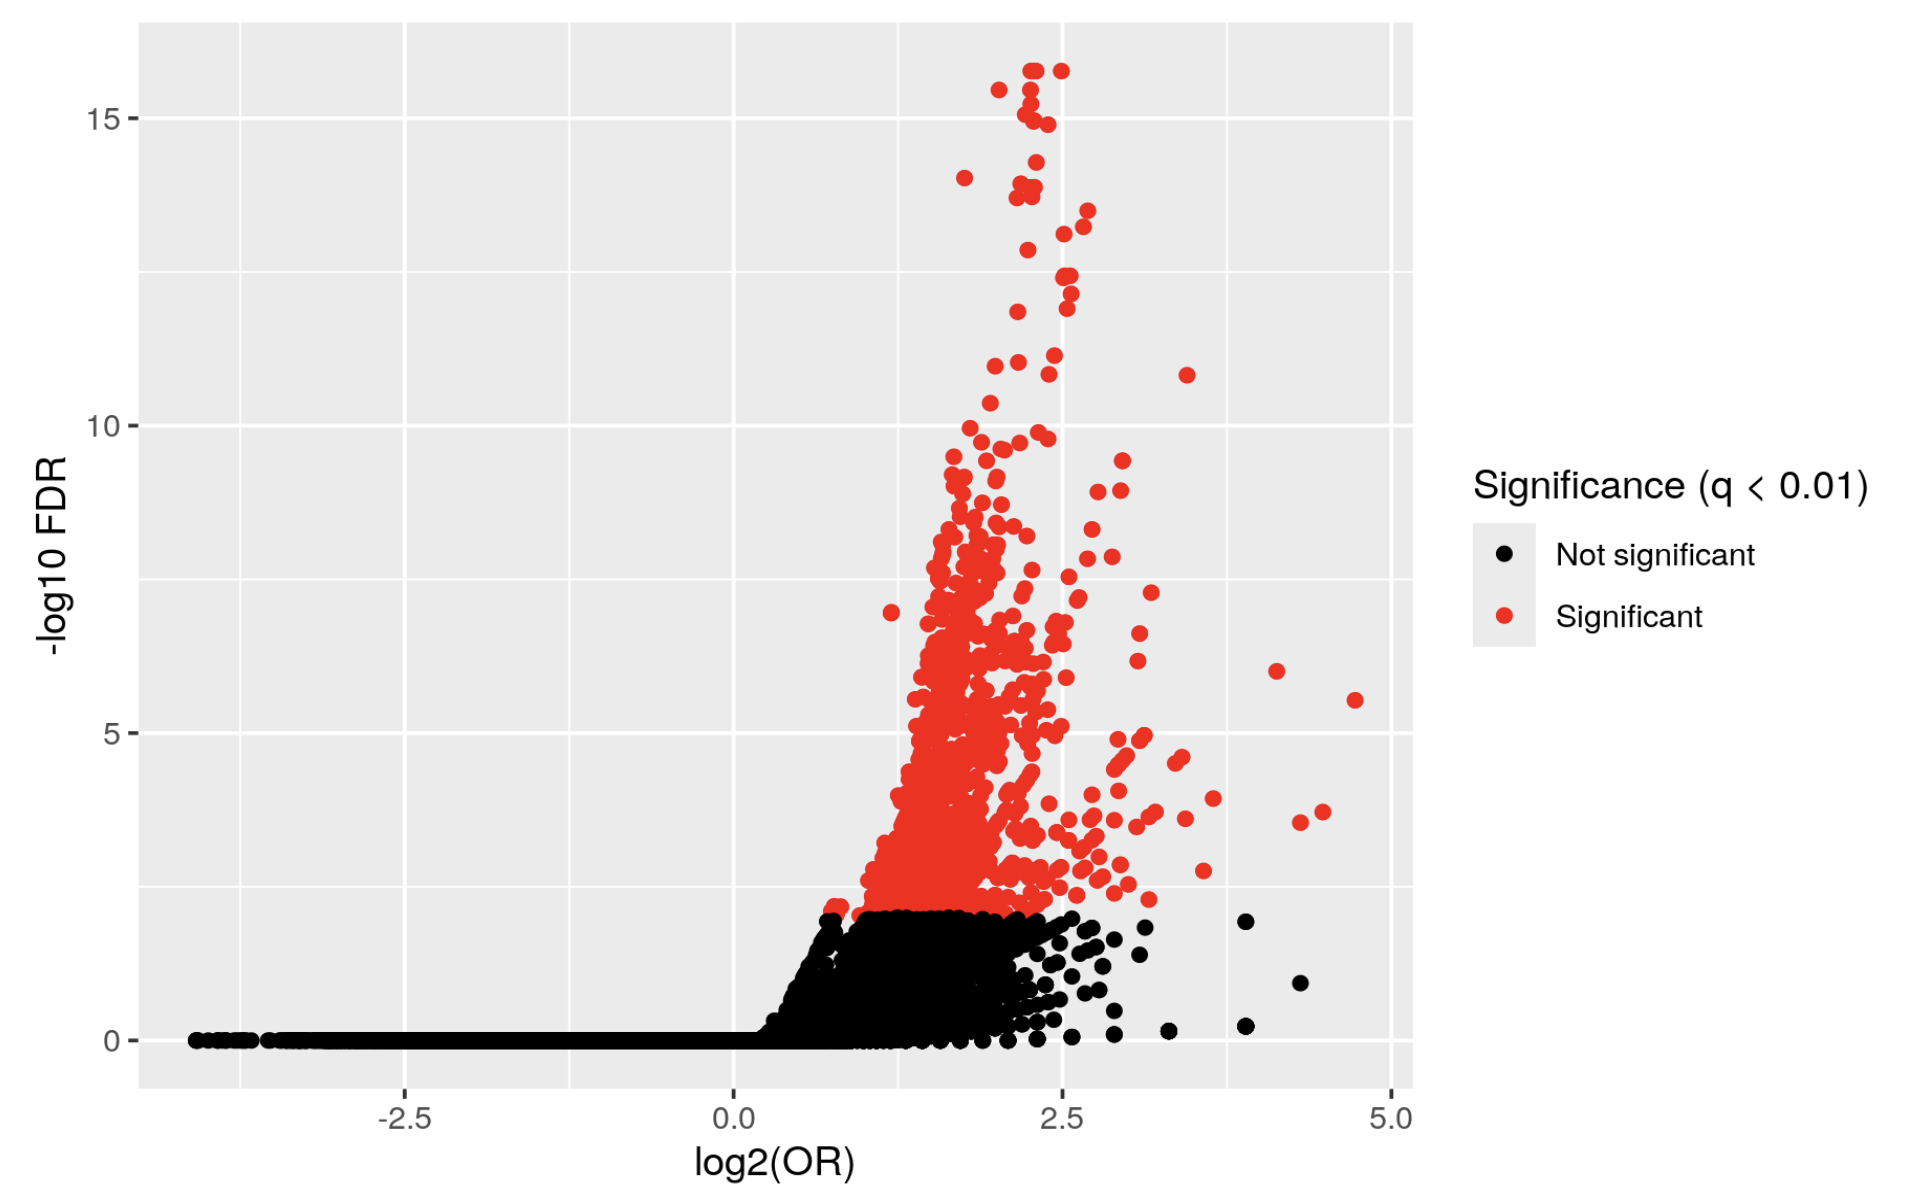
Which doesn't really make sense. I actually inverted the condition

colData(se)$condition <- relevel(factor(colData(se)$EBV), "Negative")

and I get a similar graph, whereas if the first one were true, I think the graph would be inverted.

What am I missing? where is the other half of the volcano???!!!

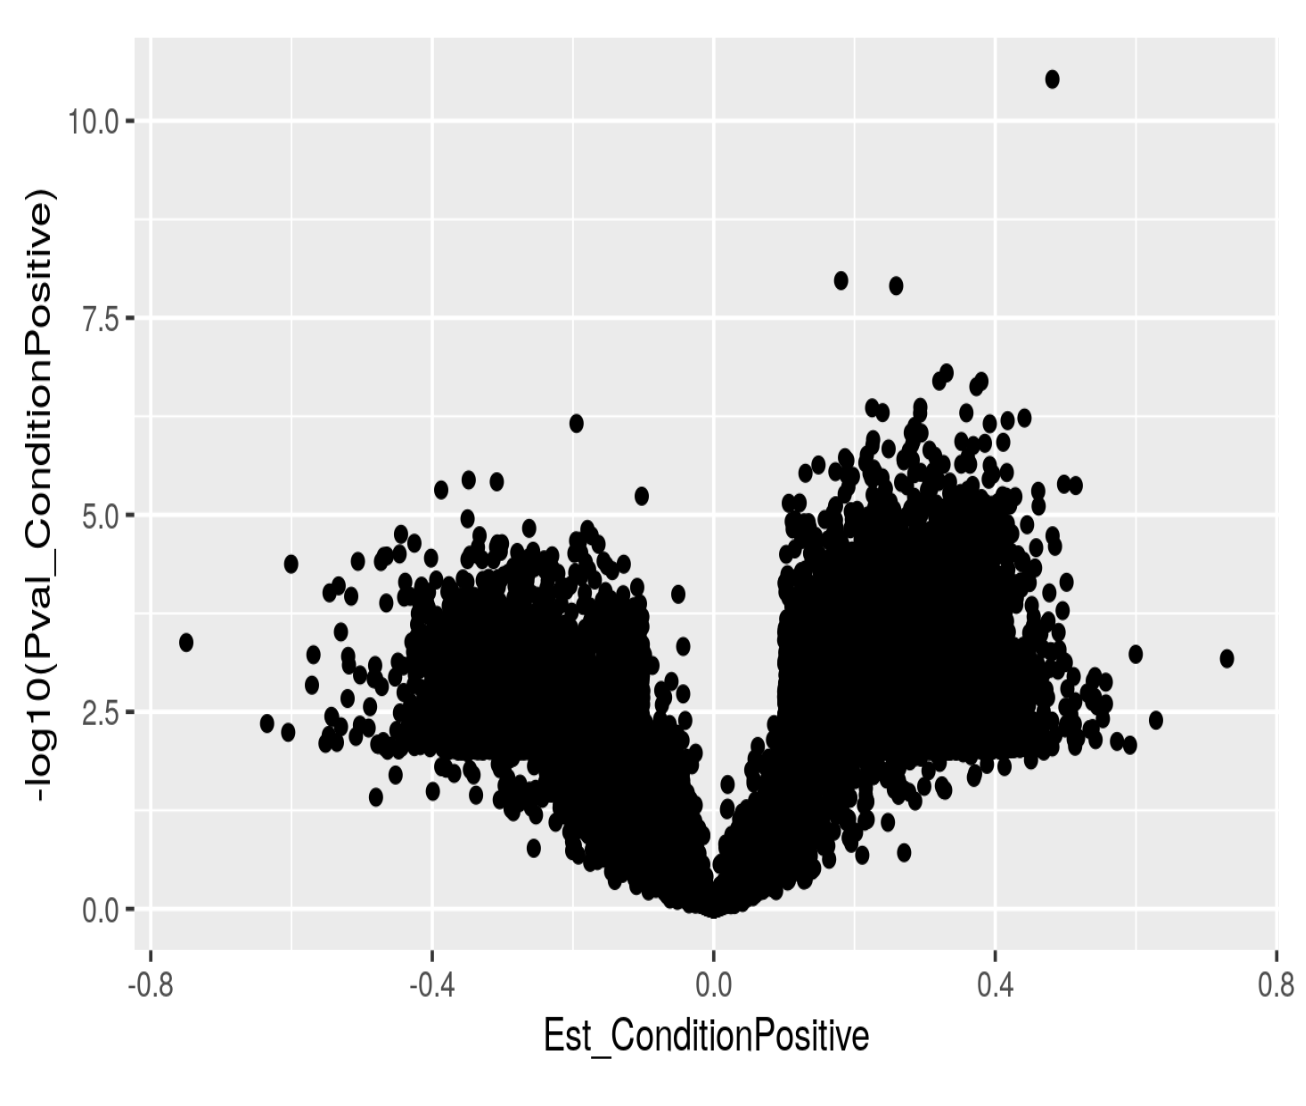
If I just plot log10 pvalues as a function of effect size I do get what I would expect: enter image description here

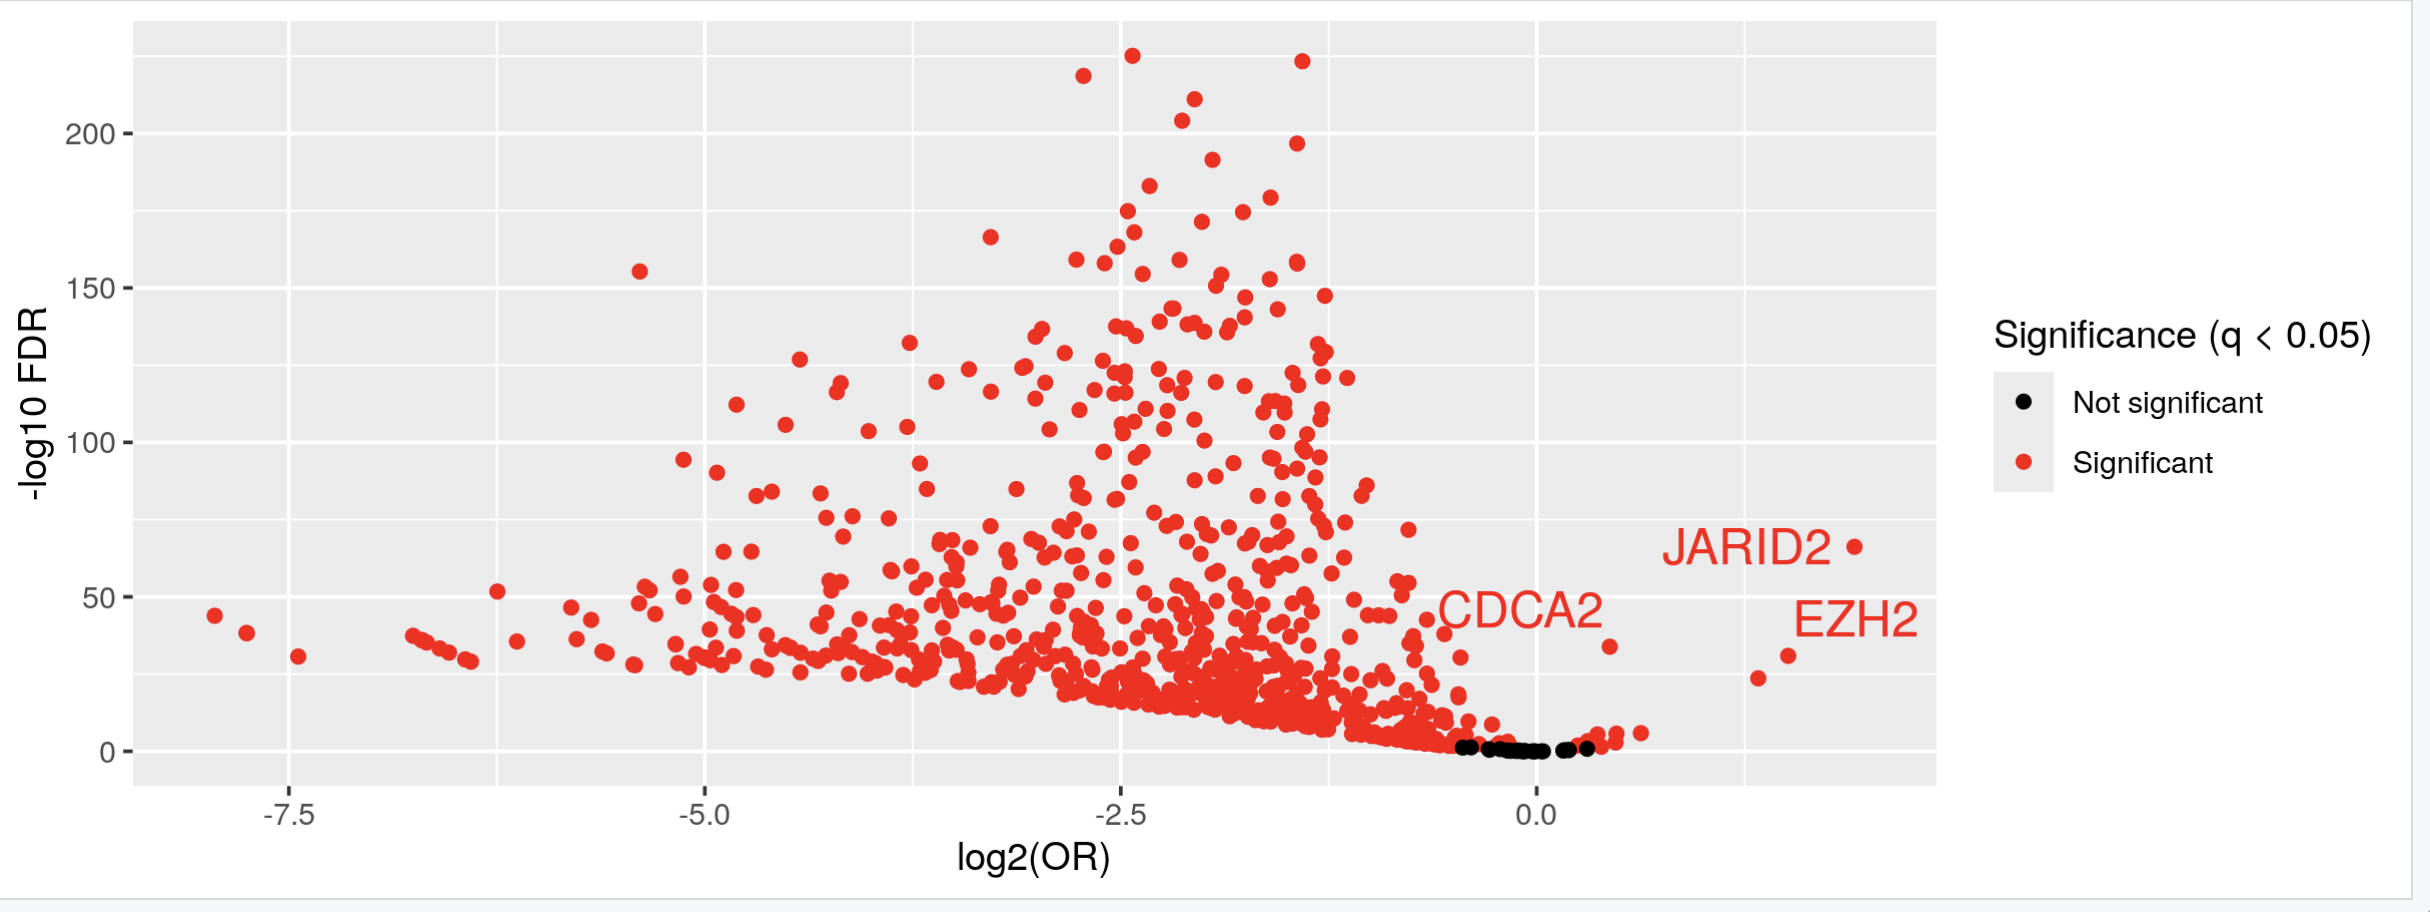
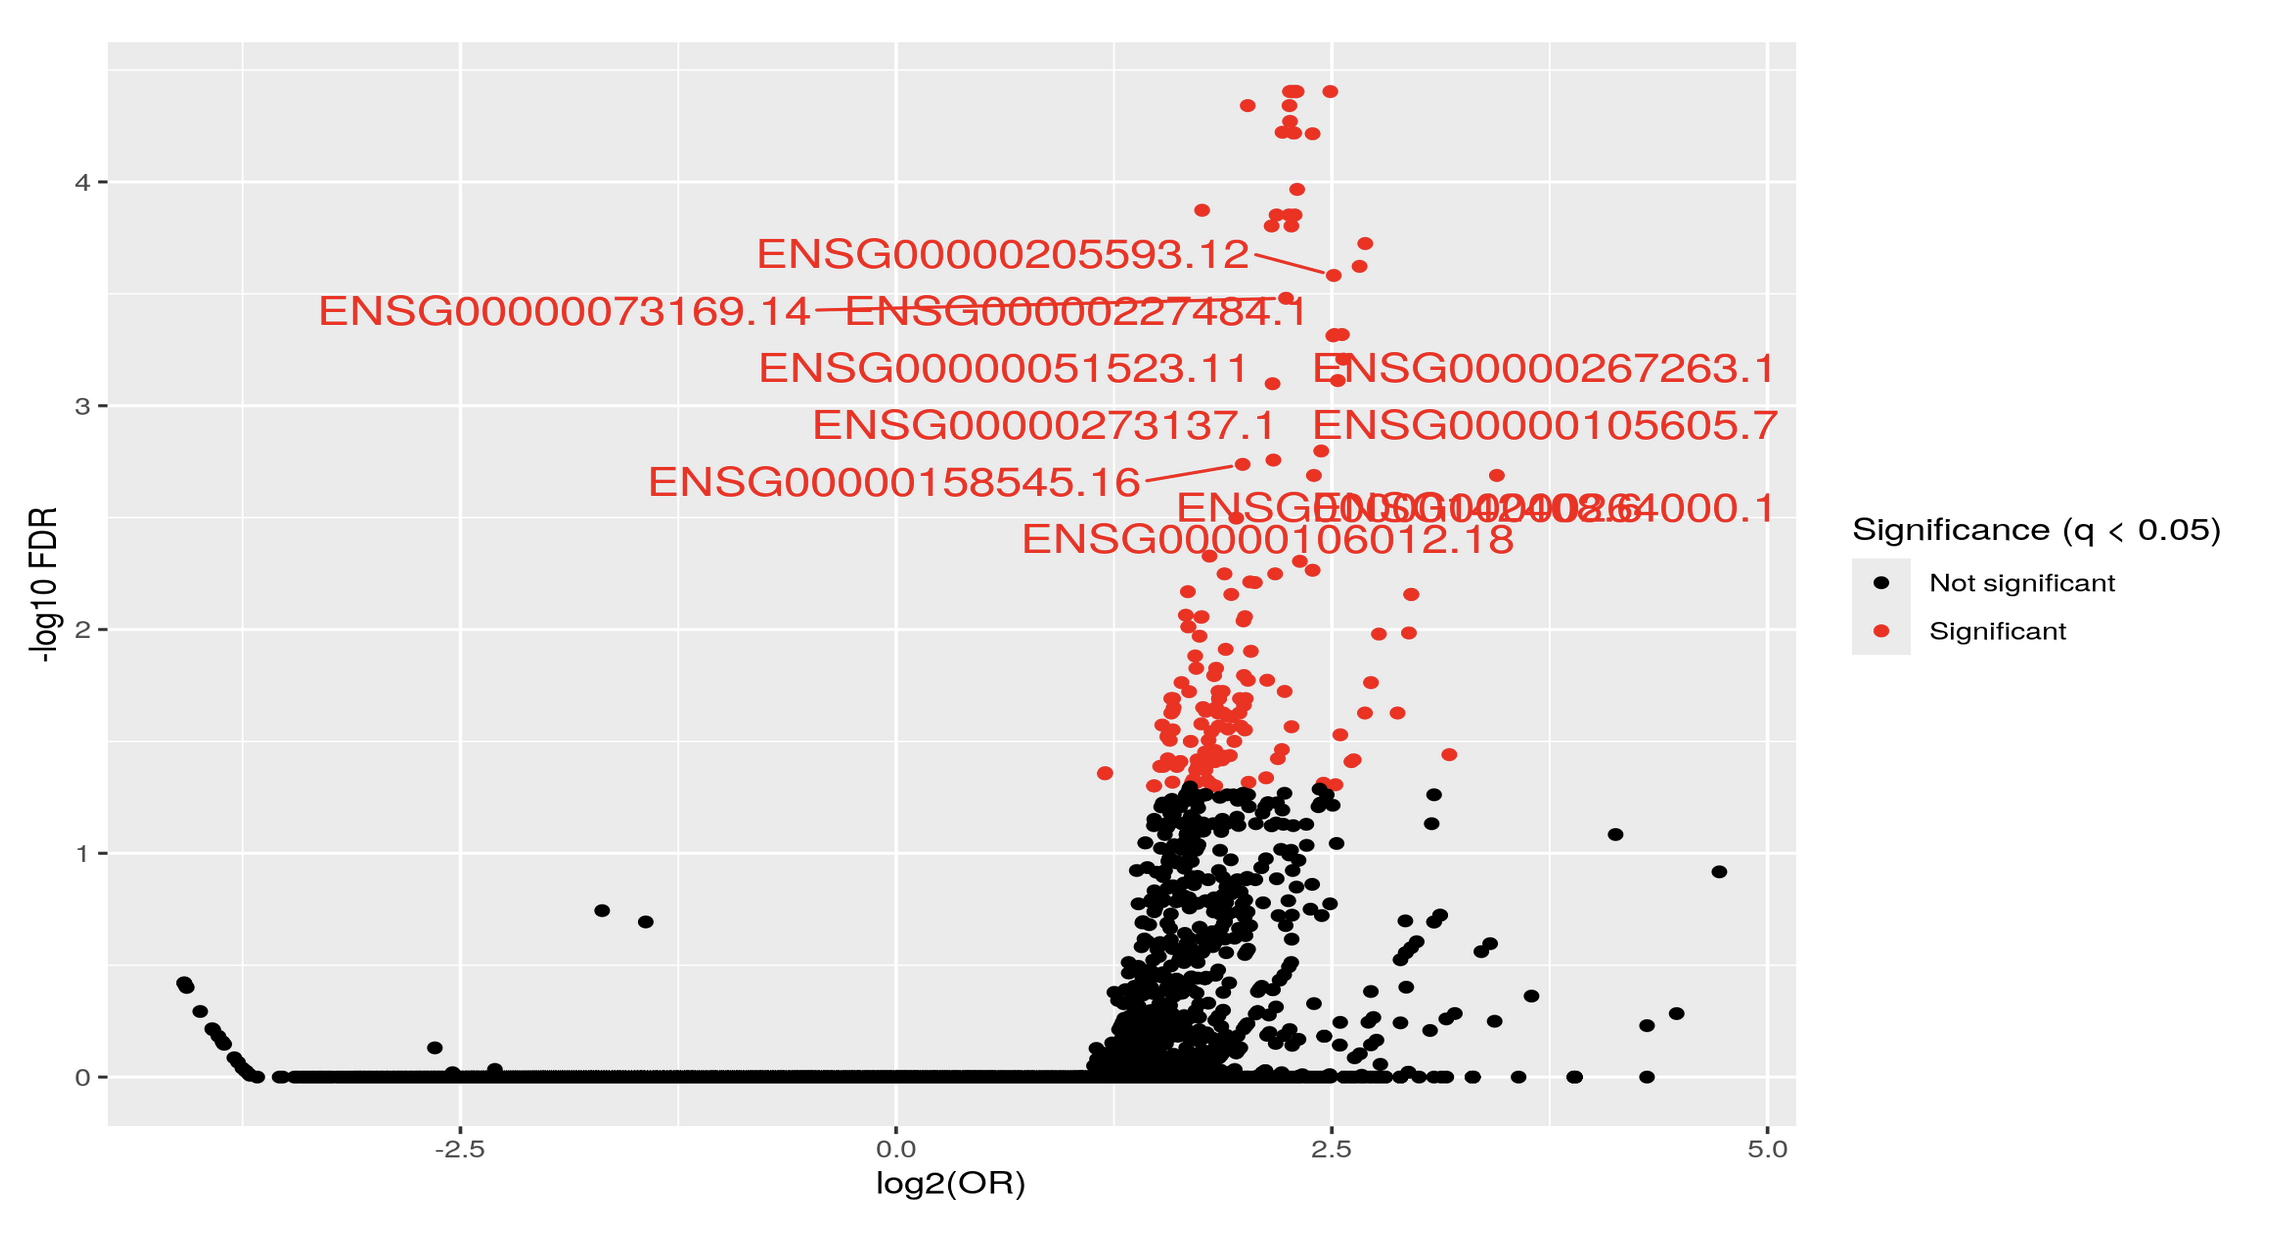
One idea is that the enrichment by gene does not relate to the "direction", and hence I would need to do the analysis separately:

dfUp <- testResult[testResult$Pval_Condition < 0.01 & testResult$Eff_Condition > 0.1 & testResult$Est_Condition>0,]
resultUp <- testEnrichment(dfUp$Probe_ID, KYCG_buildGeneDBs(dfUp$Probe_ID, max_distance=100000, platform="EPIC"),platform="EPIC")

dfDown <- testResult[testResult$Pval_Condition < 0.01 & testResult$Eff_Condition > 0.1 & testResult$Est_Condition<0,]
resultDown <- testEnrichment(dfDown$Probe_ID, KYCG_buildGeneDBs(dfDown$Probe_ID, max_distance=100000, platform="EPIC"),platform="EPIC")

Any suggestions appreciated!!!

methylation sesame methylationArrayAnalysis • 444 views
ADD COMMENT
0
Entering edit mode

Could you post the code to generate the first volcano? It seems you expect the results of testEnrichment to be like a volcano, why do you expect so? As far as I know, over representative analysis don't have the same distribution as the moderated t-test for DEG or DEM.

ADD REPLY
0
Entering edit mode

Thank you Luís, I just did put it's just: KYCG_plotVolcano(results,label_by="gene_name",alpha=0.01) (if I understand what you wanted), but in any case, I do expect the results to be like a volcano: i.e. I expect some genes to be significant in terms of being methylated both when the conditon is positive as well as when it is negative, hence a volcano. It is of course conceivable that the majority of genes will be significant only when the condition is positive, but if I do the analysis separately:

dfUp <- testResult[testResult$Pval_Condition < 0.01 & testResult$Eff_Condition > 0.1 & testResult$Est_Condition>0,]
resultUp <- testEnrichment(dfUp$Probe_ID, KYCG_buildGeneDBs(dfUp$Probe_ID, max_distance=100000, platform="EPIC"),platform="EPIC")

dfDown <- testResult[testResult$Pval_Condition < 0.01 & testResult$Eff_Condition > 0.1 & testResult$Est_Condition<0,]
resultDown <- testEnrichment(dfDown$Probe_ID, KYCG_buildGeneDBs(dfDown$Probe_ID, max_distance=100000, platform="EPIC"),platform="EPIC")

I do get significant genes in both way. I am not sure if I am interpreting the odds ratio correctly perhaps? Thank you so much and let me know if you have any other ideas.

ADD REPLY
0
Entering edit mode
@james-w-macdonald-5106
Last seen 3 hours ago
United States

The default for testEnrichment is a one-tailed test. If you want a two-tailed test you have to specify that.

0
Entering edit mode

Thank you very much for helping a beginner.

To your point, I did that, so there are two pieces of evidence which don't quite compute: If I do a two-tailed test on the TBFS database I get:

query <- testResult[testResult$Pval_Condition < 0.01 & testResult$Eff_Condition > 0.1,"Probe_ID"]
results <- testEnrichment(query, KYCG_buildGeneDBs(query, max_distance=100000, platform="EPIC"),platform="EPIC",alternative = "two.sided")

enter image description here

Which in itself is suggestive, yet if I do a two-tailed test on the genes I get:

enter image description here

On the other hand, if I take a top gene and plot the betas I get something sensible:

enter image description here

Yet, if I do an analysis focusing only on the "negative sided" probes and get a top gene I also get something sensible:

enter image description here

yet on the "all data two-tailed" results spreadsheet, this last gene appears with a POSITIVE odds ratio. This is what leads me to think that I might be missing something.

estimate    p.value log10.p.value   test    nQ  nD  overlap cf_Jaccard  cf_overlap  cf_NPMI cf_SorensenDice FDR group   dbname  gene_name
2.49107061  4.78679465972258e-09    -8.319955202    Log2(OR)    28209   321 51  0.001790793 0.158878505 0.162750821 0.003575184 3.94576569640812e-05    KYCG.EPIC.gene.00000000 ENSG00000196576.15  PLXNB2

Any suggestons?

ADD REPLY
0
Entering edit mode

In the other thread I pointed out that filtering on the p-value AND the logFC is fraught because you are mixing population parameter estimates with sample estimates, as well as invalidating your p-values. So to repeat, you shouldn't be doing that.

If you insist (it's your analysis, so it's up to you do analyze and defend what you did), do note that you are filtering on only positive logFC values. Perhaps you want to use the absolute value?

0
Entering edit mode

Hello, Thank you. I absolutely respect what you mention about p-values and logFC, I was just going to tackle that soon and thank you for pointing it out, it's definitely on my radar and just. need to understand things better but will look at it deeply next, it's just one things at the time at the moment.

Why do you say that I am filtering only on the positive logFC values? I don't see where I am doing that? (perhaps that is the error that I am not seeing)

Again, thank you very much.

ADD REPLY
0
Entering edit mode
testResult$Eff_Condition > 0.1
0
Entering edit mode

The odds ratio, not log FC. My bad.

0
Entering edit mode

Thank you, the strange thing is that I am only getting positive effect sizes. I see two relevant definitions:

  • Eff_* : The effect size of each normal contrast variable. This is equivalent to the maximum slope subtracted by the minimum level including the reference level (0).
  • Est_* : The slope estimate (aka the beta coefficient, not to be confused with the DNA methylation beta-value though) for continuous variable. DNA methylation difference of the current level with respect to the reference level for nominal contrast variables. Each suffix is concatenated from the contrast variable name (e.g., tissue, sex) and the level name if the contrast variable is discrete (e.g, Cecum, Esophagus, Fat). For example, Est_tissueFat should be interpreted as the estimated methylation level difference of Fat compared to the reference tissue (which is Colon, as set above). If reference is not set, the first level in the alphabetic order is used as the reference level. There is a special column named Est_(Intercept). It corresponds to the base-level methylation of the reference (in this case a Female Colon sample).

I need to do some homework in terms of understanding the statistical model used, but I just wanted to point out that the effect sizes seem to be always positive here.

ADD REPLY
0
Entering edit mode

Oh, ok. For background, I don't use sesame, so this is new territory for me as well.

I see why the effect size is always positive though - it's defined that way. If you take the difference between the largest and smallest contrast variable, it's by definition positive. The Est_* is the individual coefficient beta value, which isn't apparently the logFC, but is just the FC.

0
Entering edit mode

Thank you very much. What package do you use/recommend? (I see there are several options, so I went with sesame but I don't have to use that).

ADD REPLY
0
Entering edit mode

I use minfi for preprocessing and DMRcate for DMR. I like preprocessFunnorm (and possibly the XY-interpolated version in the wateRmelon package if you care about allosome CpGs), and I also like that both minfi and DMRcate use limma to analyze the M-values, rather than modeling the beta values, which I am not comfortable with.

0
Entering edit mode
zhouwanding ▴ 20
@zhouwanding-15106
Last seen 1 day ago
United States

Sorry for the late reply. I think the potential confusion comes from KYCG_plotVolcano plots the volcano for enrichment testing statistics, not the differential methylation statistics. The Est_* will tell you the direction of differential methylation. Like James mentioned, the enrichment testing is one-tailed by default (can also be two-tailed). That's why the volcano was one way. But still one needs to plot volcano for differential methylation manually.

We are in the process of separating the KYCG functionalities to avoid this confusion. Hope this clarifies.

ADD COMMENT

Login before adding your answer.

Traffic: 406 users visited in the last hour
Help About
FAQ
Access RSS
API
Stats

Use of this site constitutes acceptance of our User Agreement and Privacy Policy.

Powered by the version 2.3.6