
Hello all,
I was wondering if someone could possibly help me with creating an appropriate design matrix for some RNA-seq data. There are 244 samples, 125 of phenotype "A" and 119 of phenotype "B" with 3 different sampling stages ("early", "late", and "mid") and 4 different tissue types. Basically, the data has the following relevant metadata categories: phenotype (pheno), tissue_type, sampling_stage, cultivar, and group, which is a concatenation of the phenotype and the sampling_stage and the primary comparison of interest here:
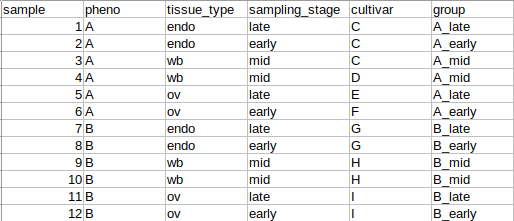
We are interested in discovering DEGs in the group comparisons only at each sampling stage between the two phenotypes (A_late - B_late, A_early - B_early, etc.). However, I'm not sure how to handle all of the other variables when creating a design matrix. The MDS plots indicate that there is very strong clustering of the data by both pheno and by cultivar (each cultivar has only one phenotype or the other), which we expected and were hoping to see. But there is also some degree of clustering by tissue_type. To further complicate things, tissue_type and sampling stage are somewhat related in that these are plant samples collected seasonally from the field, so some types of tissue are only available during certain sampling stages.
When I do the model like this..
design = model.matrix(~0 + group)
...I get a BCV of 1.35.
When I do it like this...
design.group.tissue_type = model.matrix(~0 + group + tissue_type)
...I get a slight improvement of BCV at 1.32.
Here is an image of the plot:
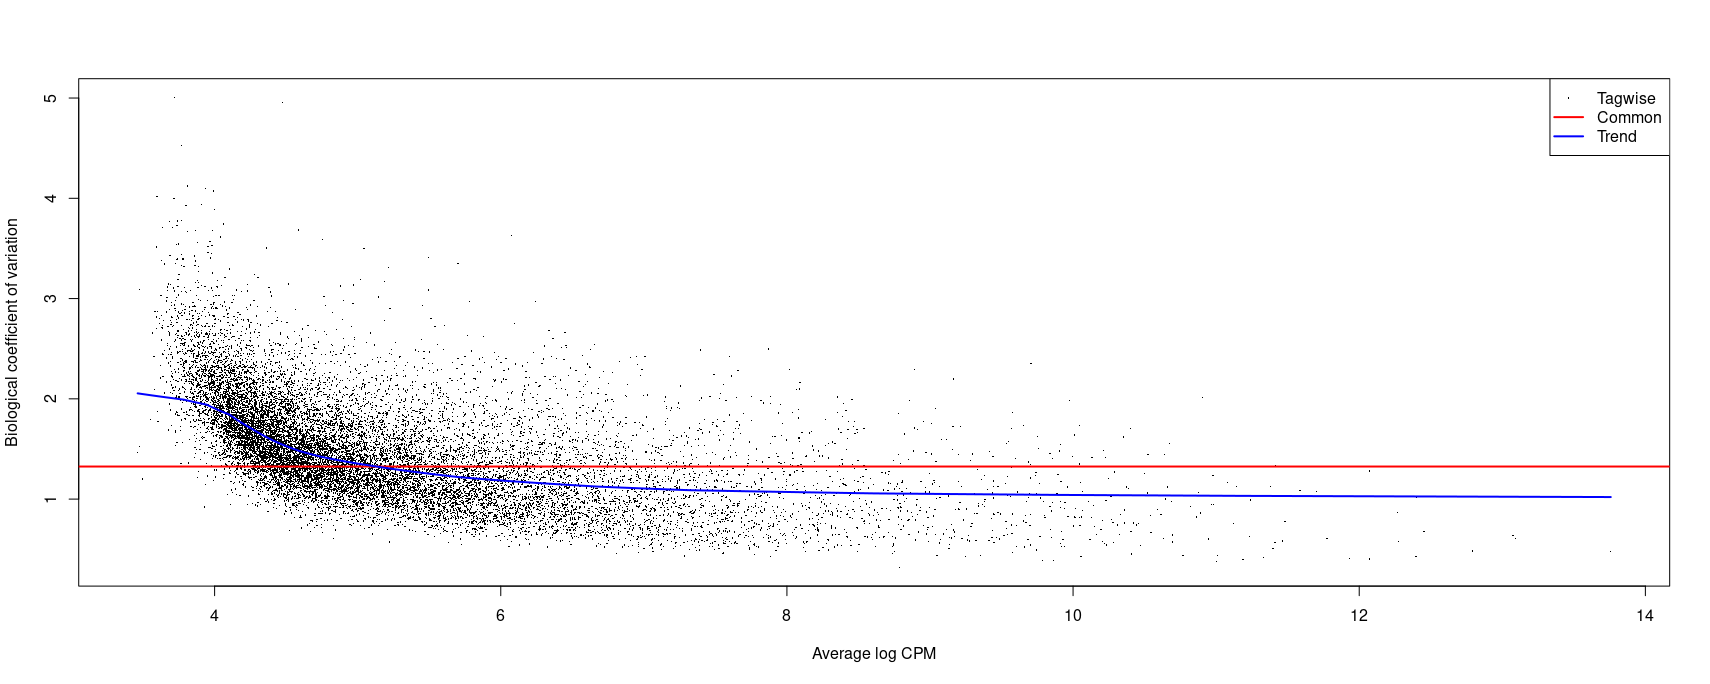
So my question is what is the appropriate model to use here? I think some of my confusion comes from the fact that I don't fully understand how to interpret BCV. It could be that the values I have are OK but I'm overthinking this since they seem a bit higher than those that I've seen in other forum threads and publications.
Thanks!
Code should be placed in three backticks as shown below
# include your problematic code here with any corresponding output
# please also include the results of running the following in an R session

sessionInfo( )
