Hi all,
I've posted this on biostars alos, as I m not sure it is appropriate on here. Let me know if this quesiton needs removing
About the data: I have 5 tissues, over 100 samples , and 2 variables of interest: RFI (High, Low) and Trial (1, 2). The trial variable is basically a surrogate for genotype, as the main difference between trials is the genotype of the animals. All samples were collected, and then processed in the lab by the same person. I don't know the sex of each animal (but that can be obtained from the data with a bit of work). I have no other batch information.
My question: I don't want to apply sva to model a hidden batch until I am confident there actually is a hidden batch. The problem is, I need guidance to know what evidence of a hidden batch looks like. I have read that hidden batches should be evident after exploratory data analysis. For clarification, I'm showing plenty of EDA images here to help my own understanding of replies.
Thank you all in advance, Kenneth
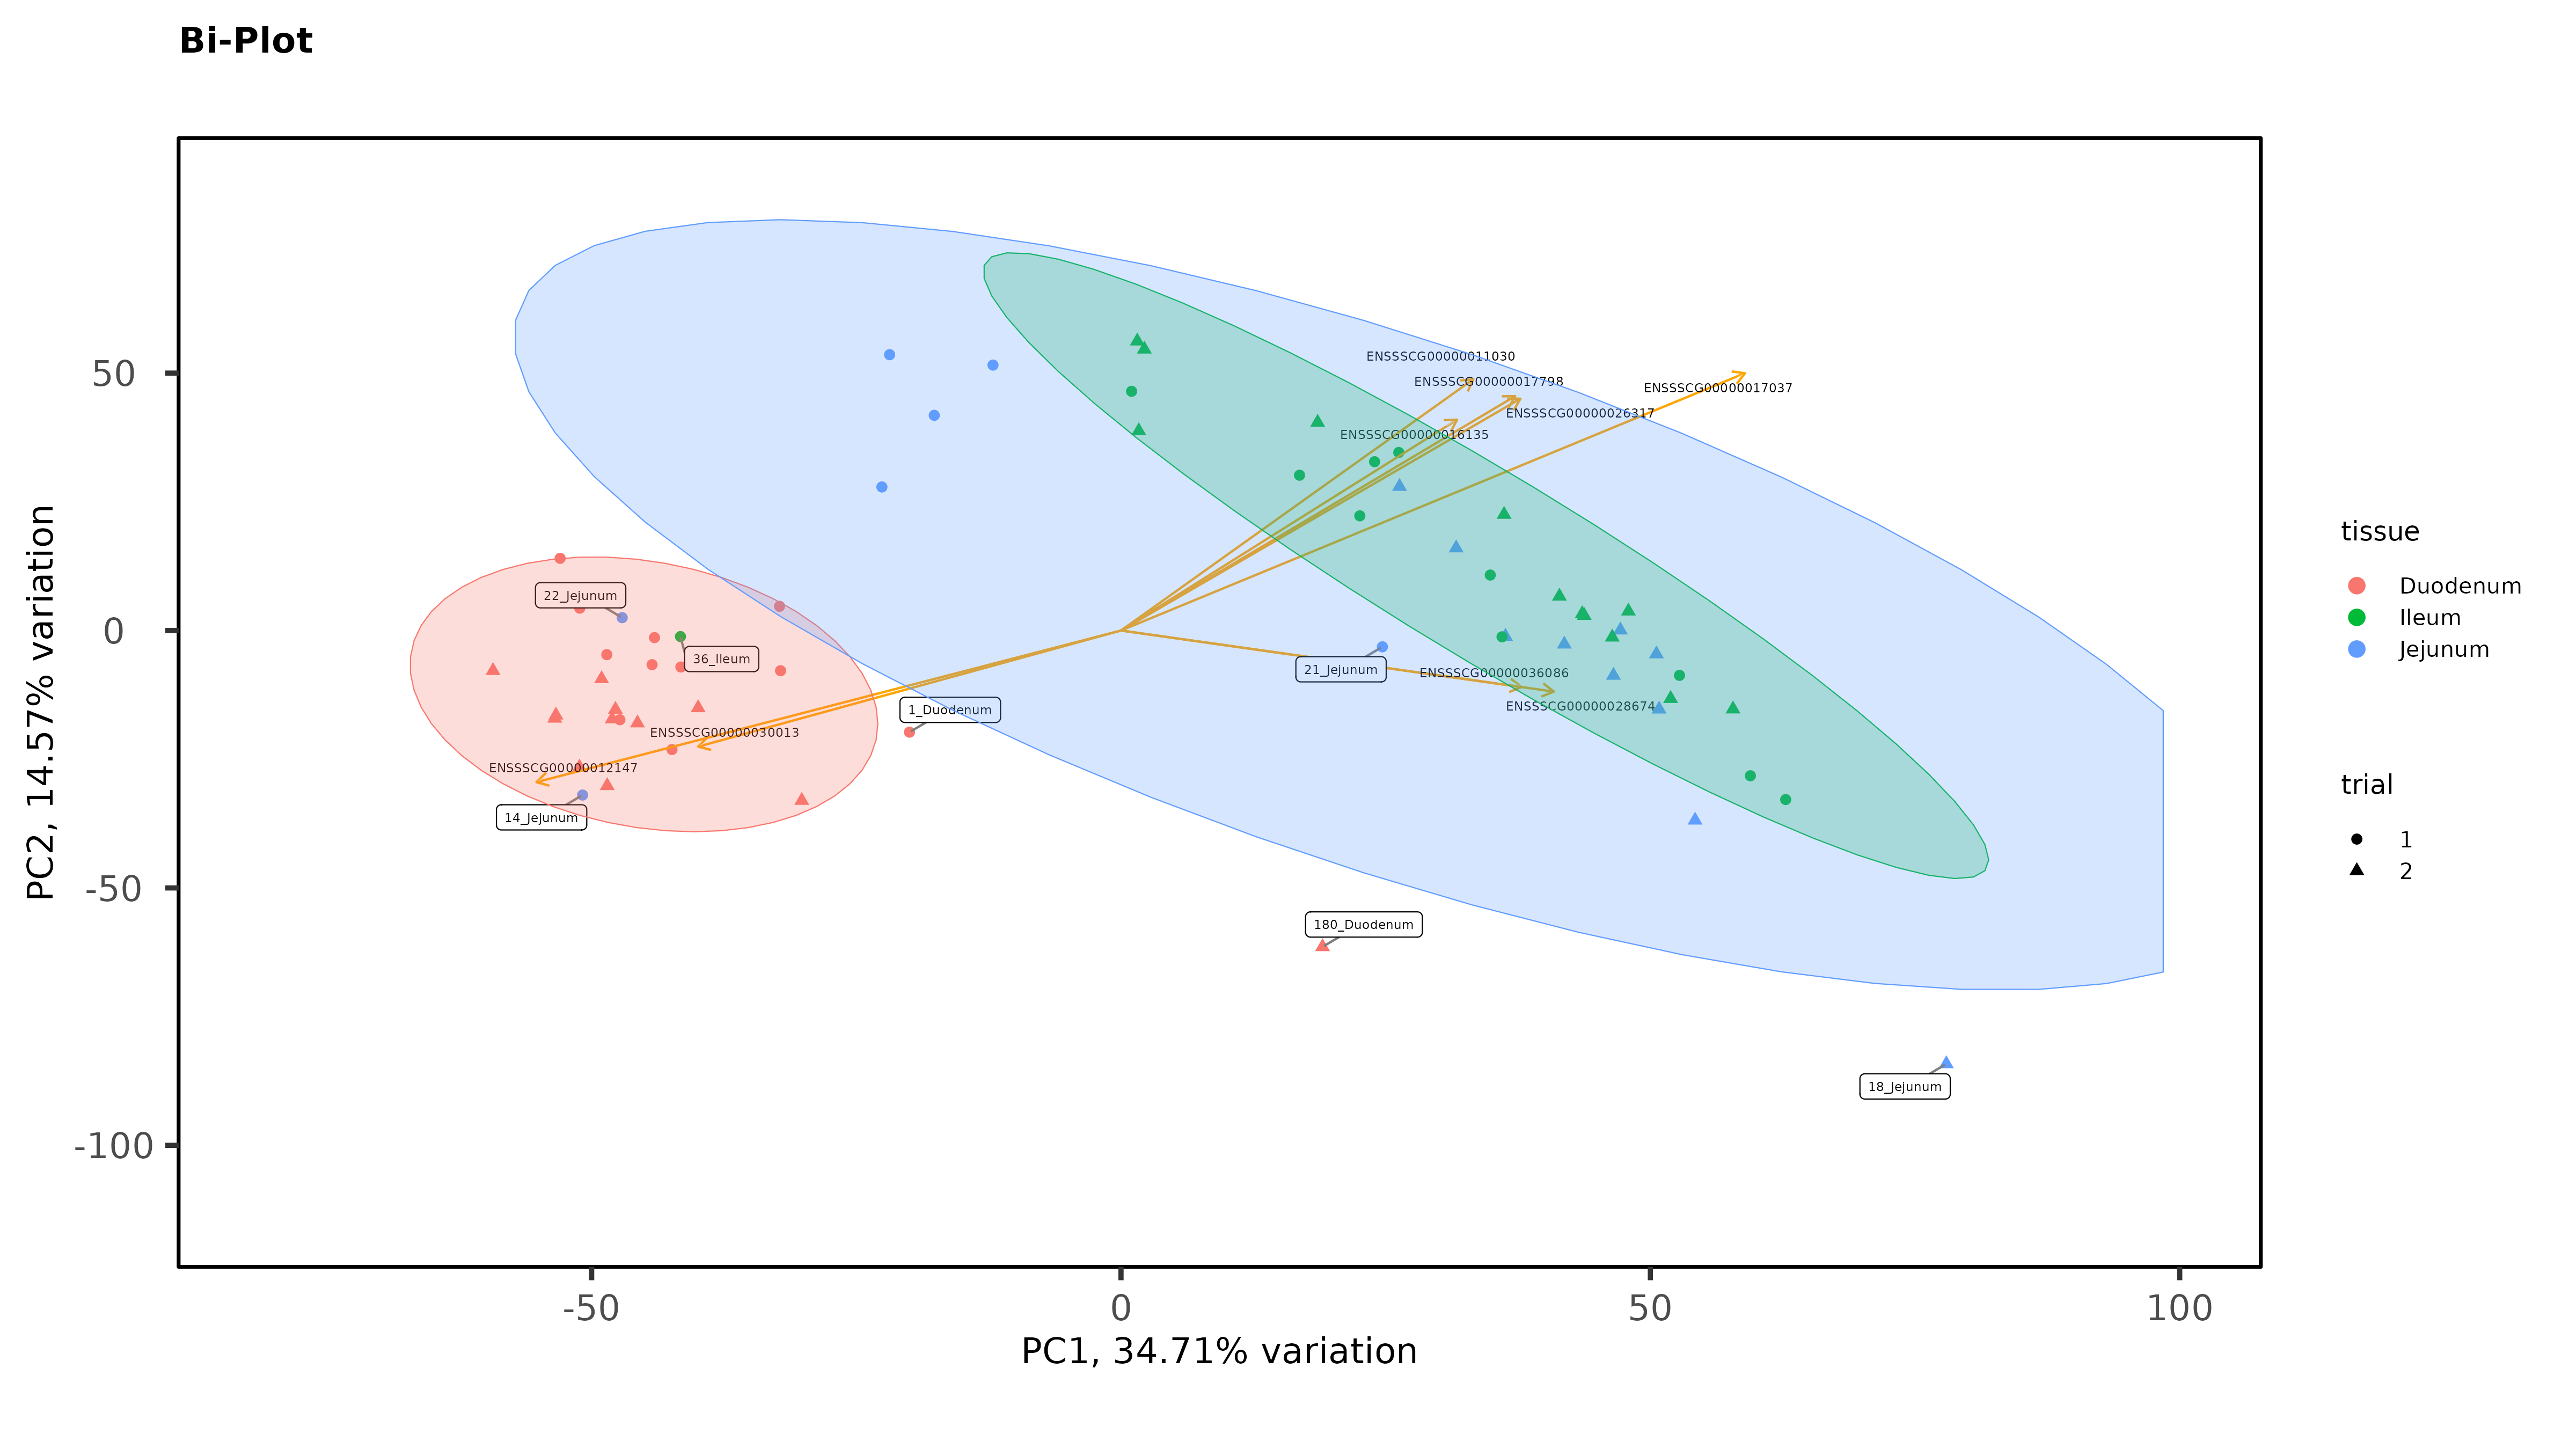
Exploratory Data Analysis results PCA separates intestinal tissues from liver, and kidney very well, with 1 outlier that has now been removed but there is no clear separation between Ileum and Jejunum even when intestinal tissues are plotted without liver and muscle:
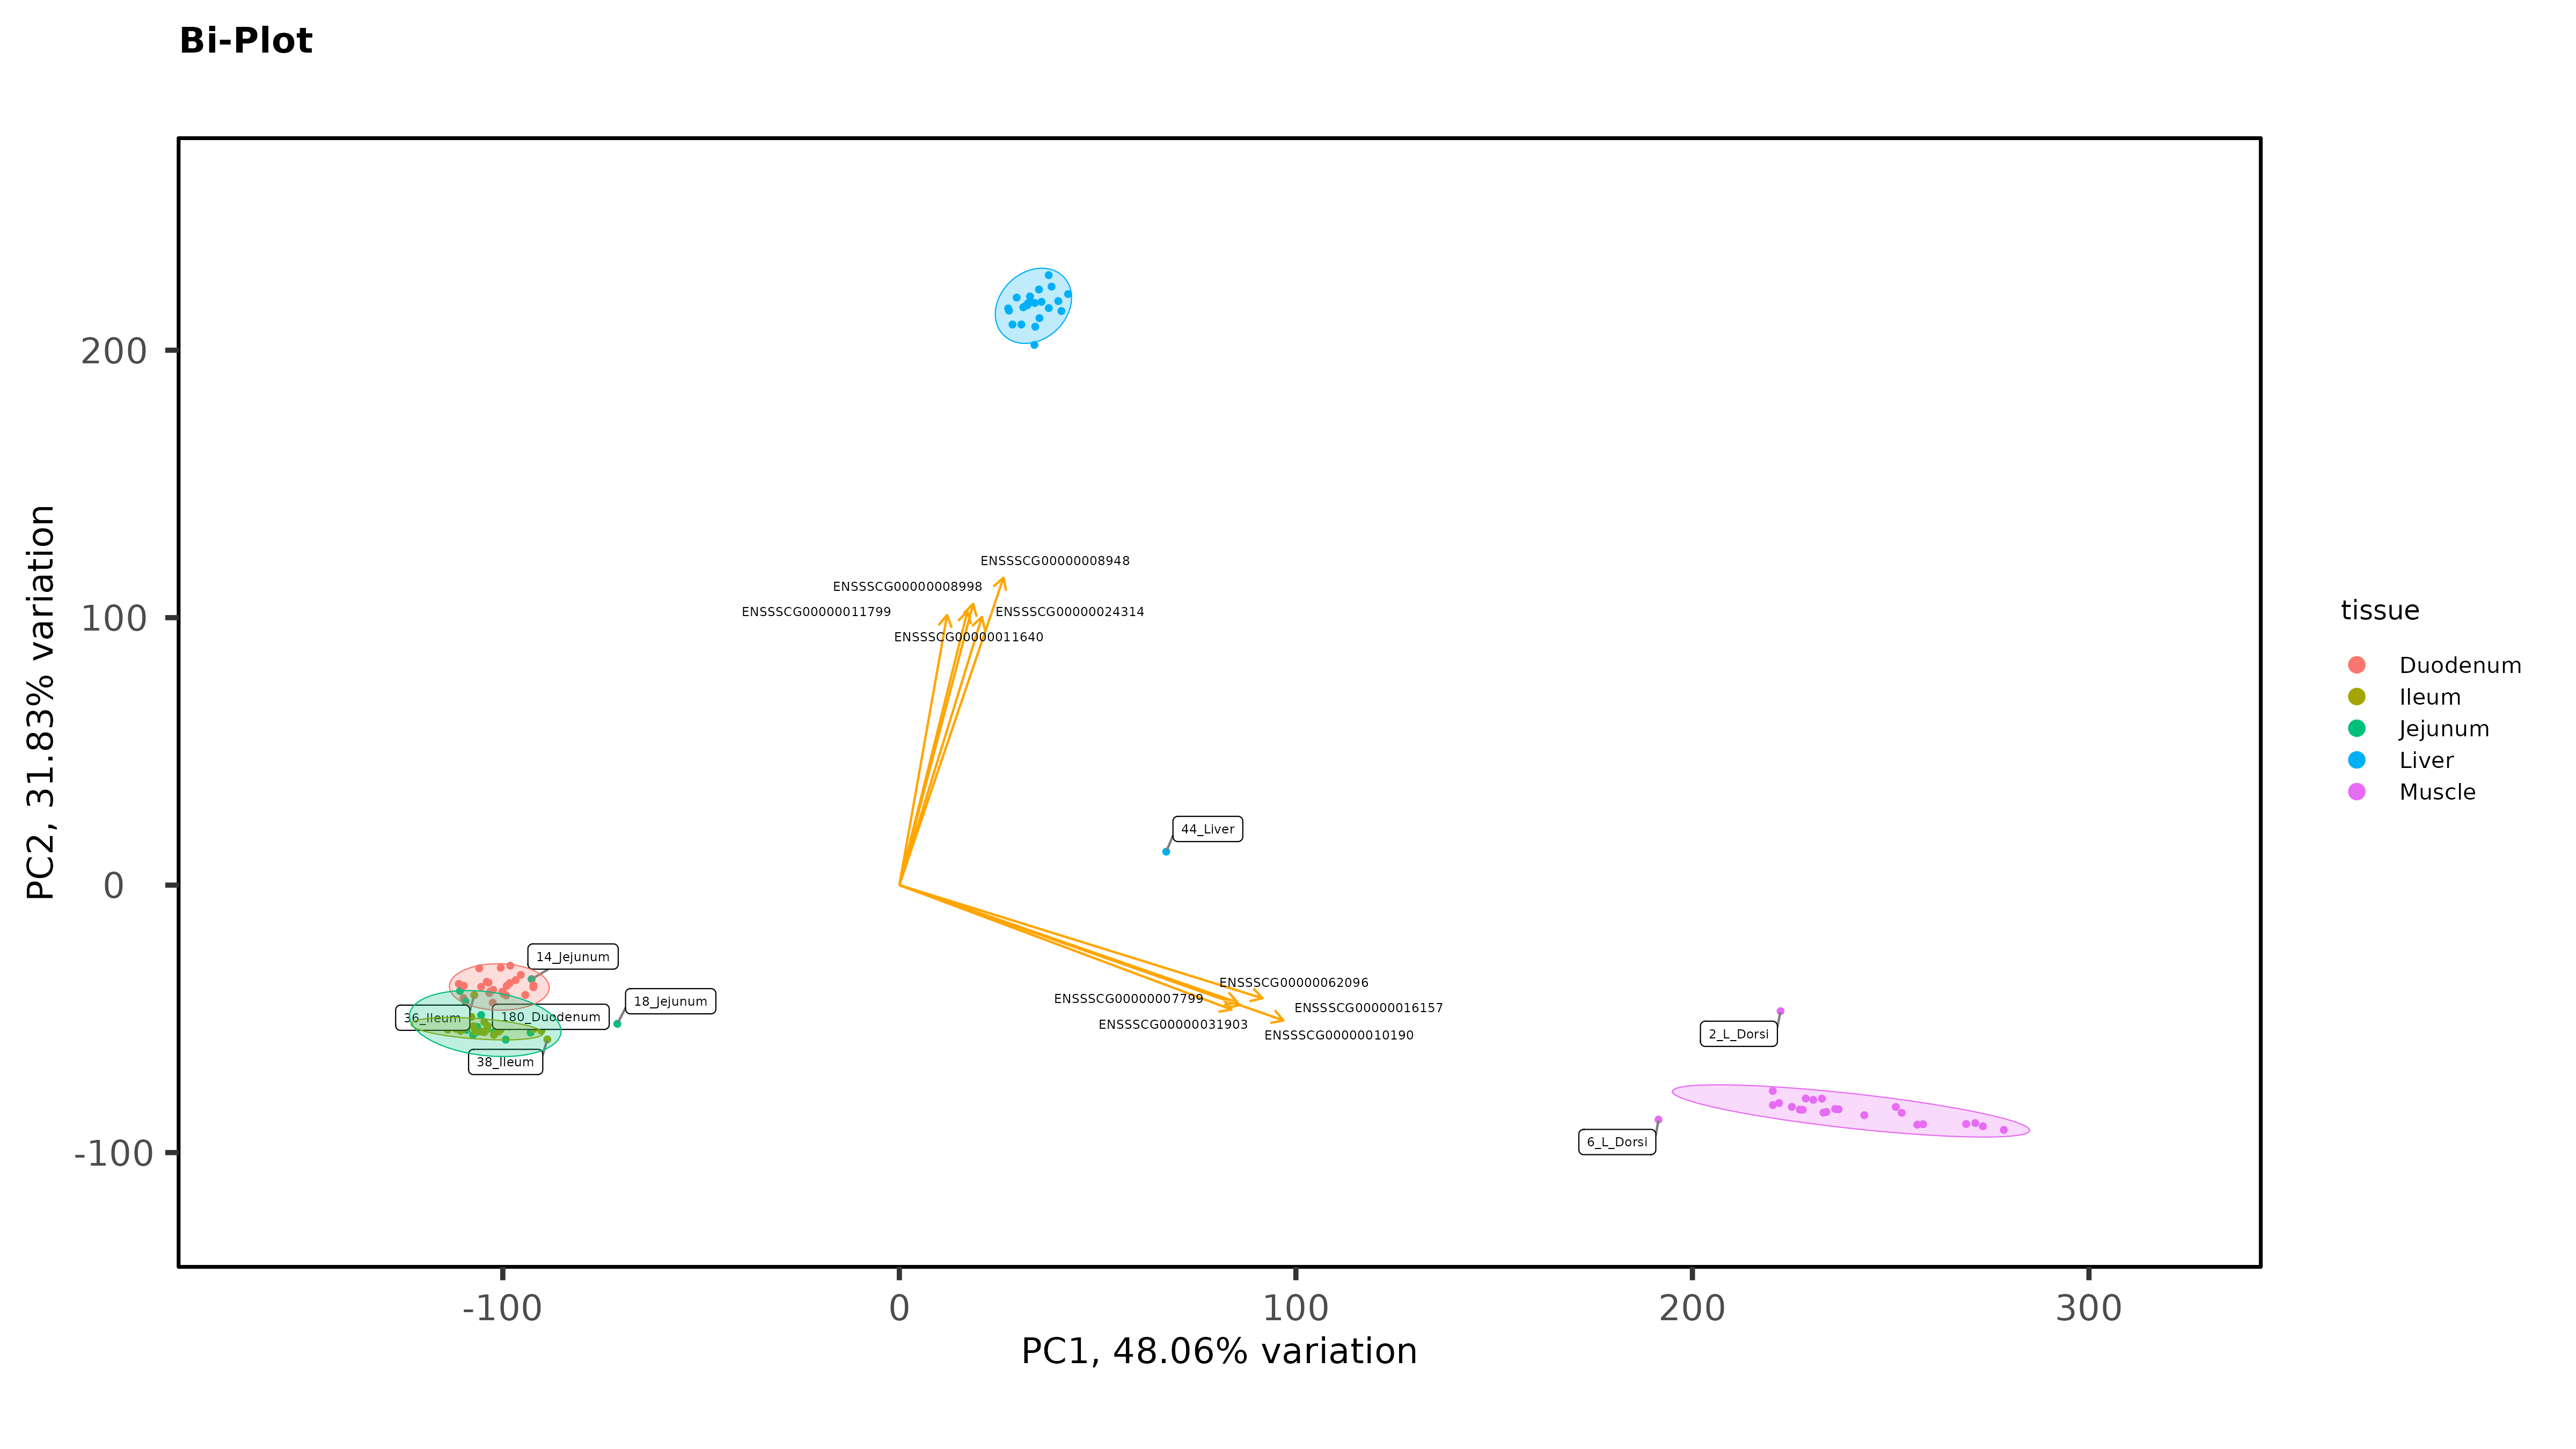
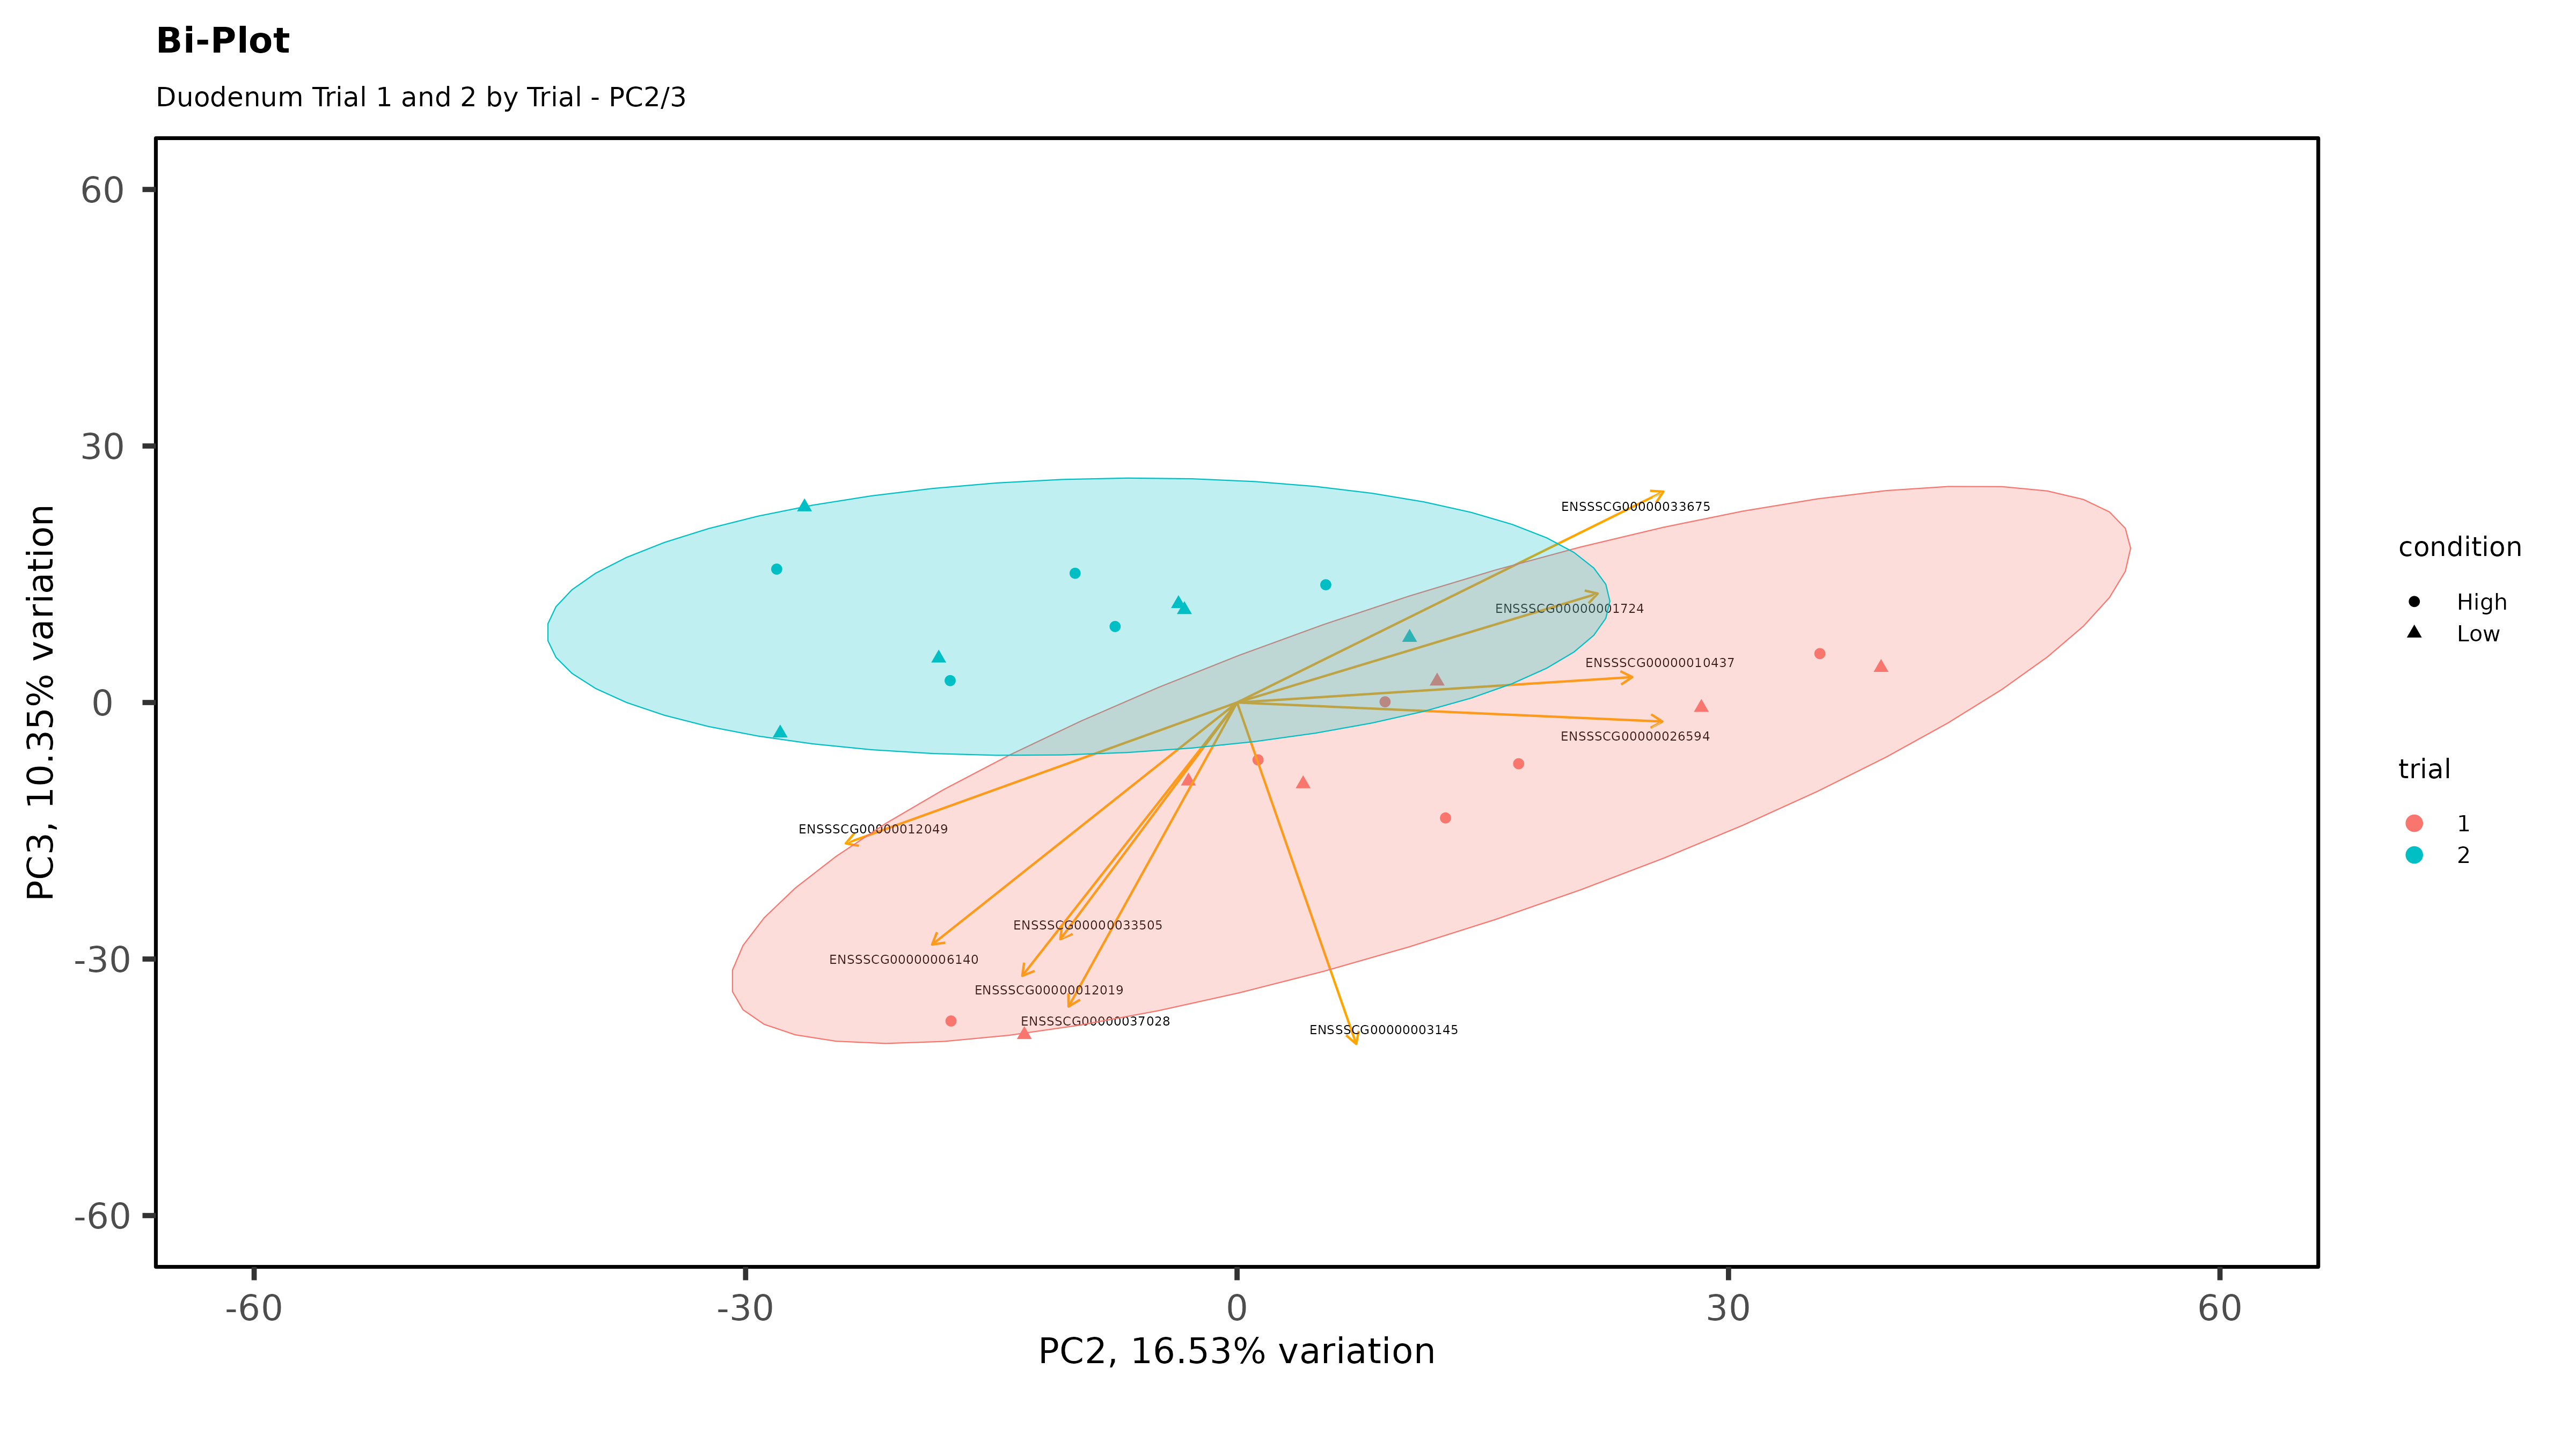
Within individual tissues, PCAs are showing some clustering by variables of interest but I don;t see any extra groups, or groups of samples sitting way off by themselves (which I think would be evidence of a hidden batch effect):
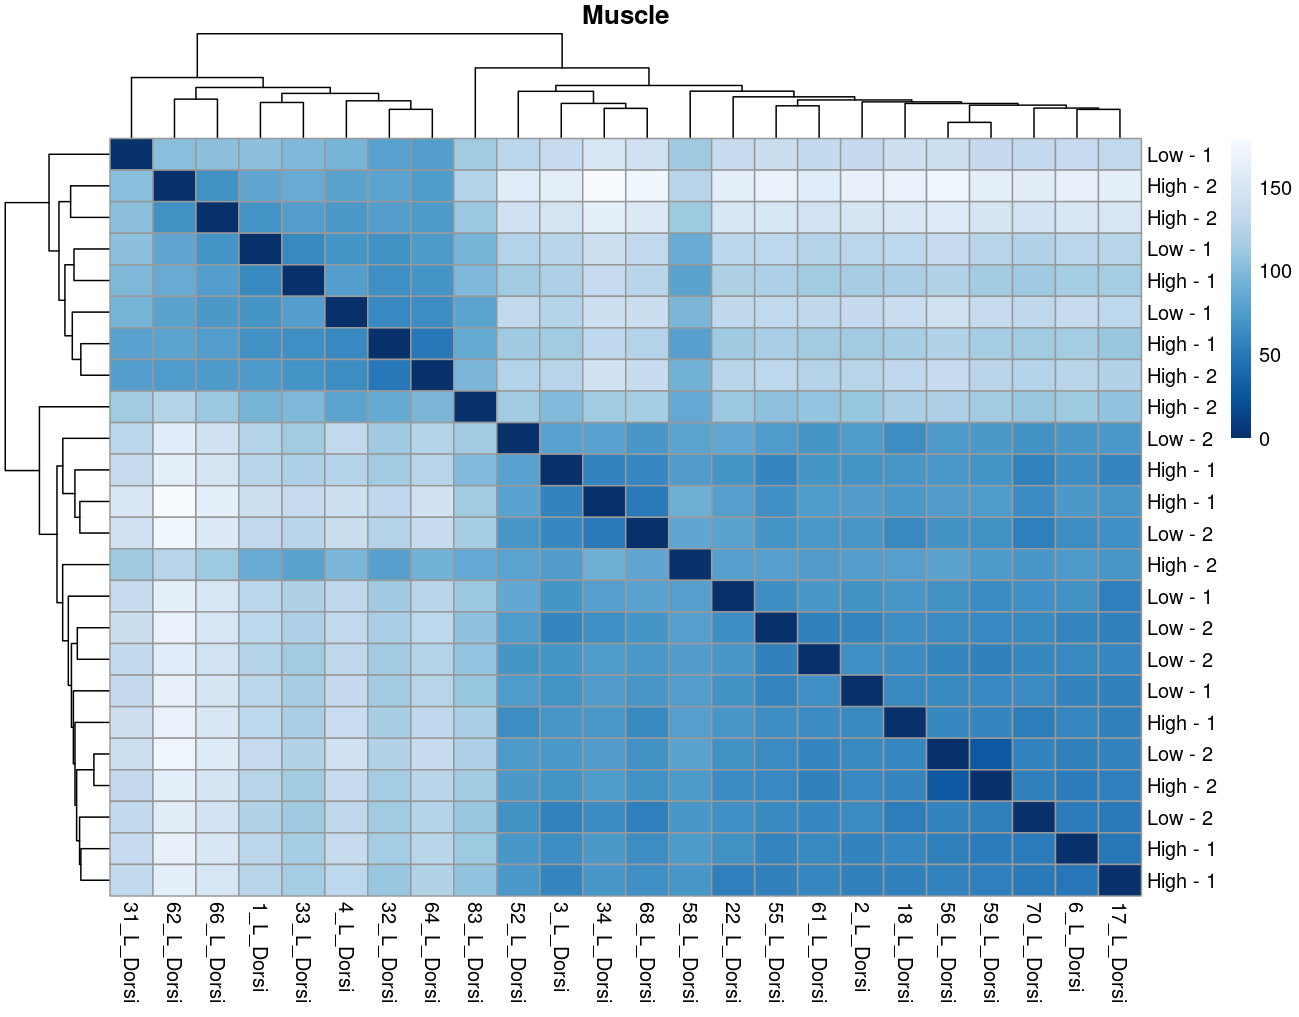
The heatmaps however are where I need a bit of guidance. Duodenal tissue is clustering weakly by trial, but Ileum, Jejunum, and Muscle show strong clusters not attributable to the variables of interest. Can I consider this evidence of a hidden batch in those tissues or could they just be biological signal that is stronger than the variables of interest? Should I use sva on these tissues or not?
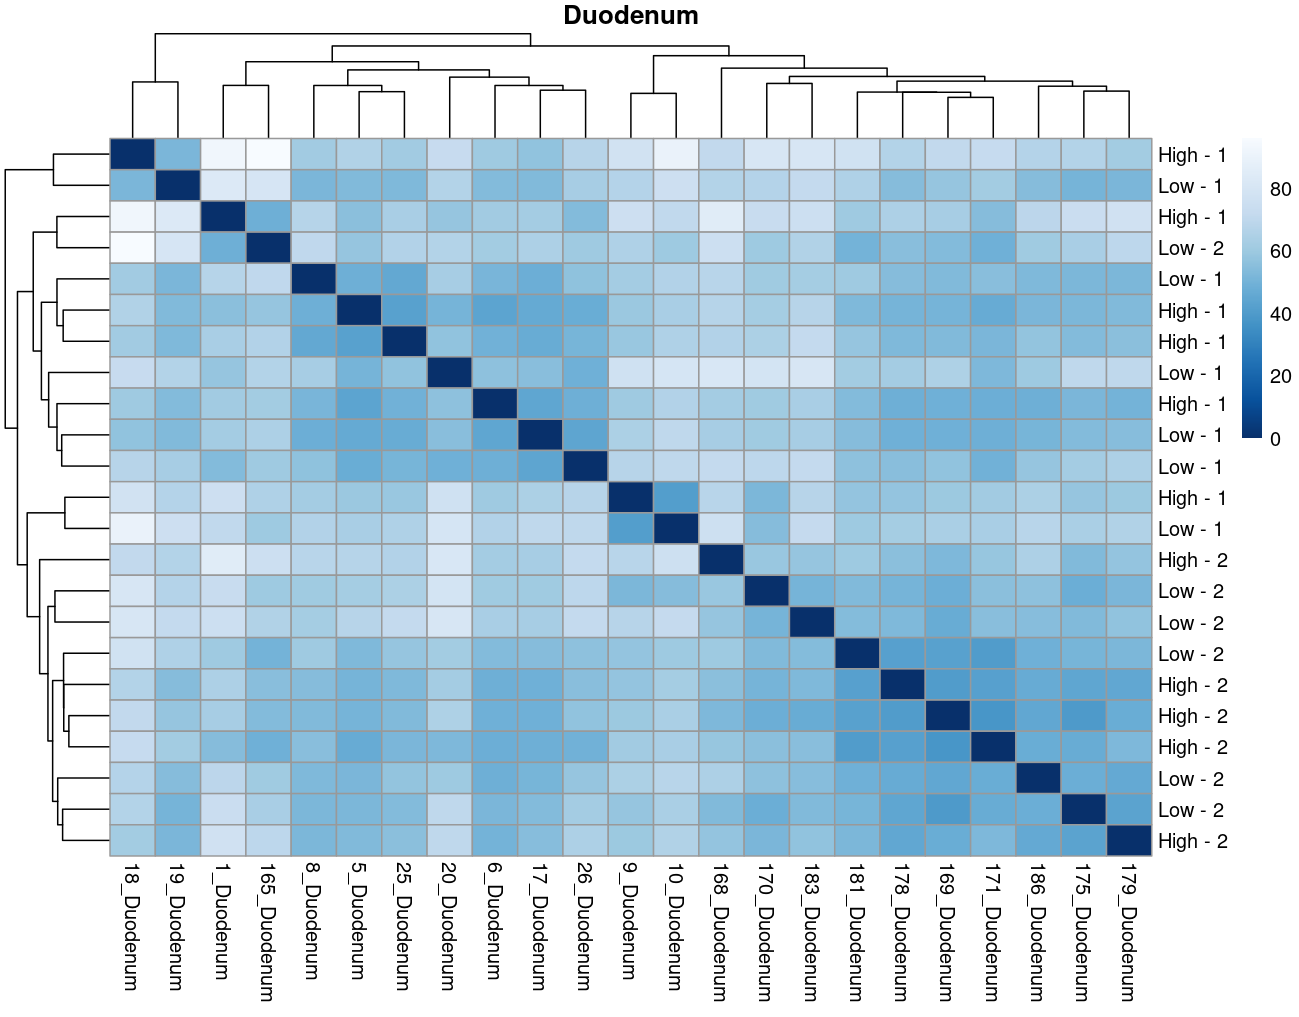
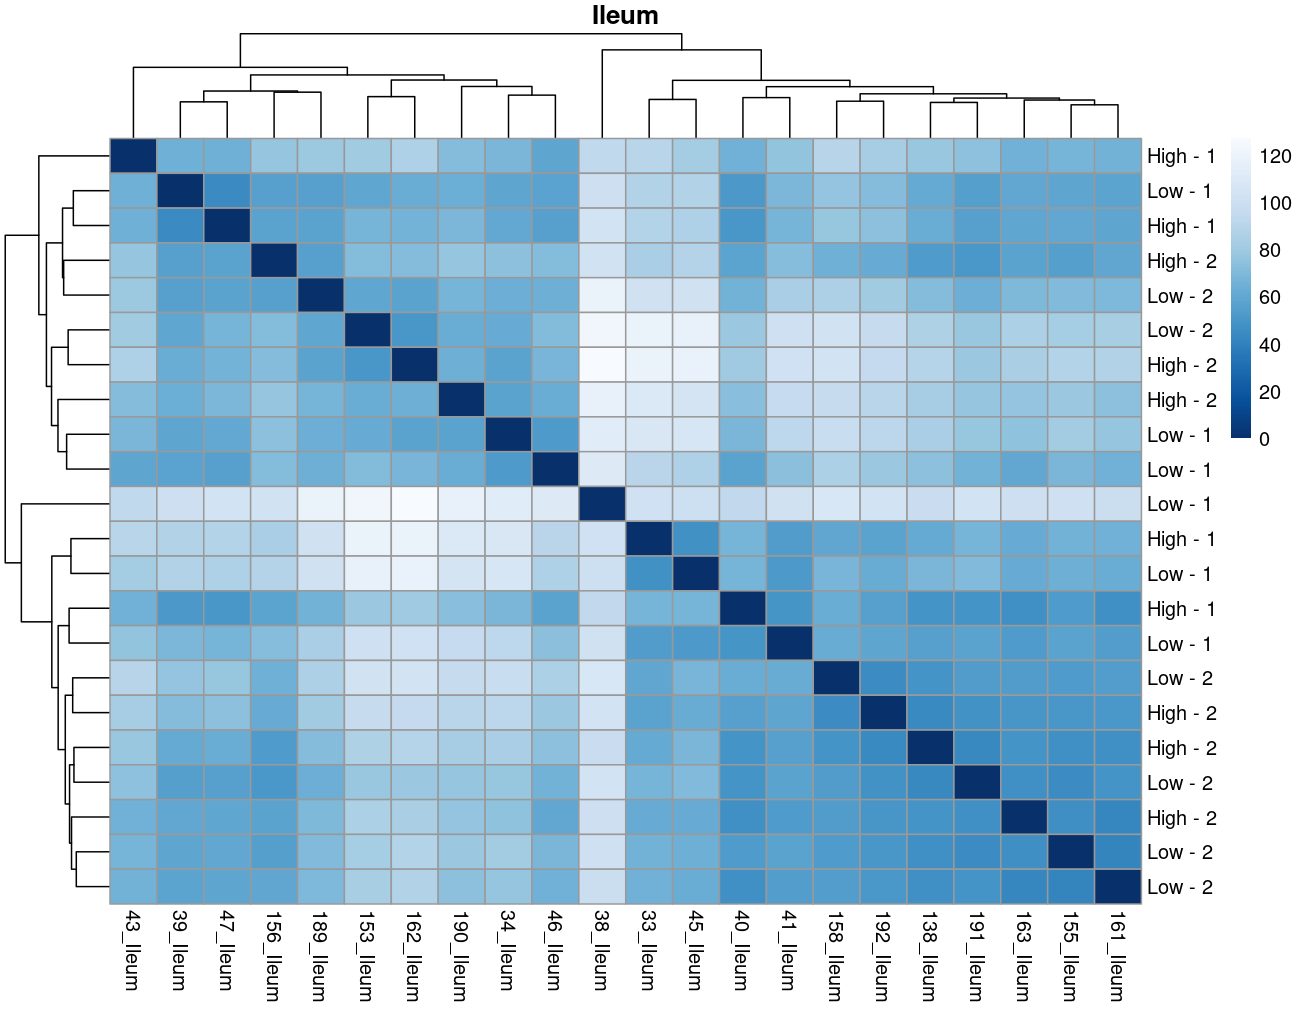
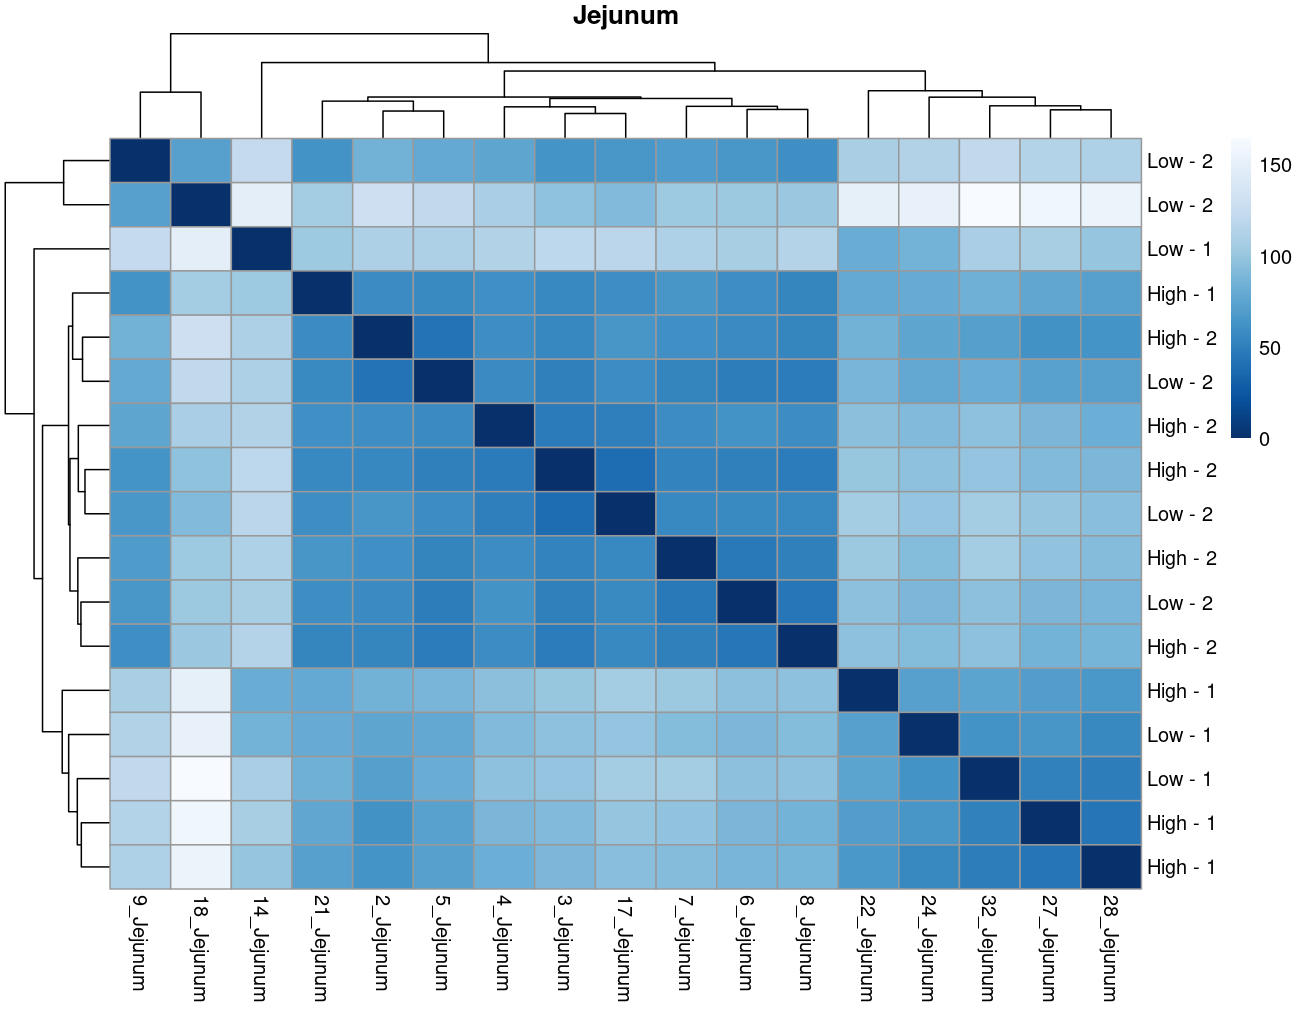
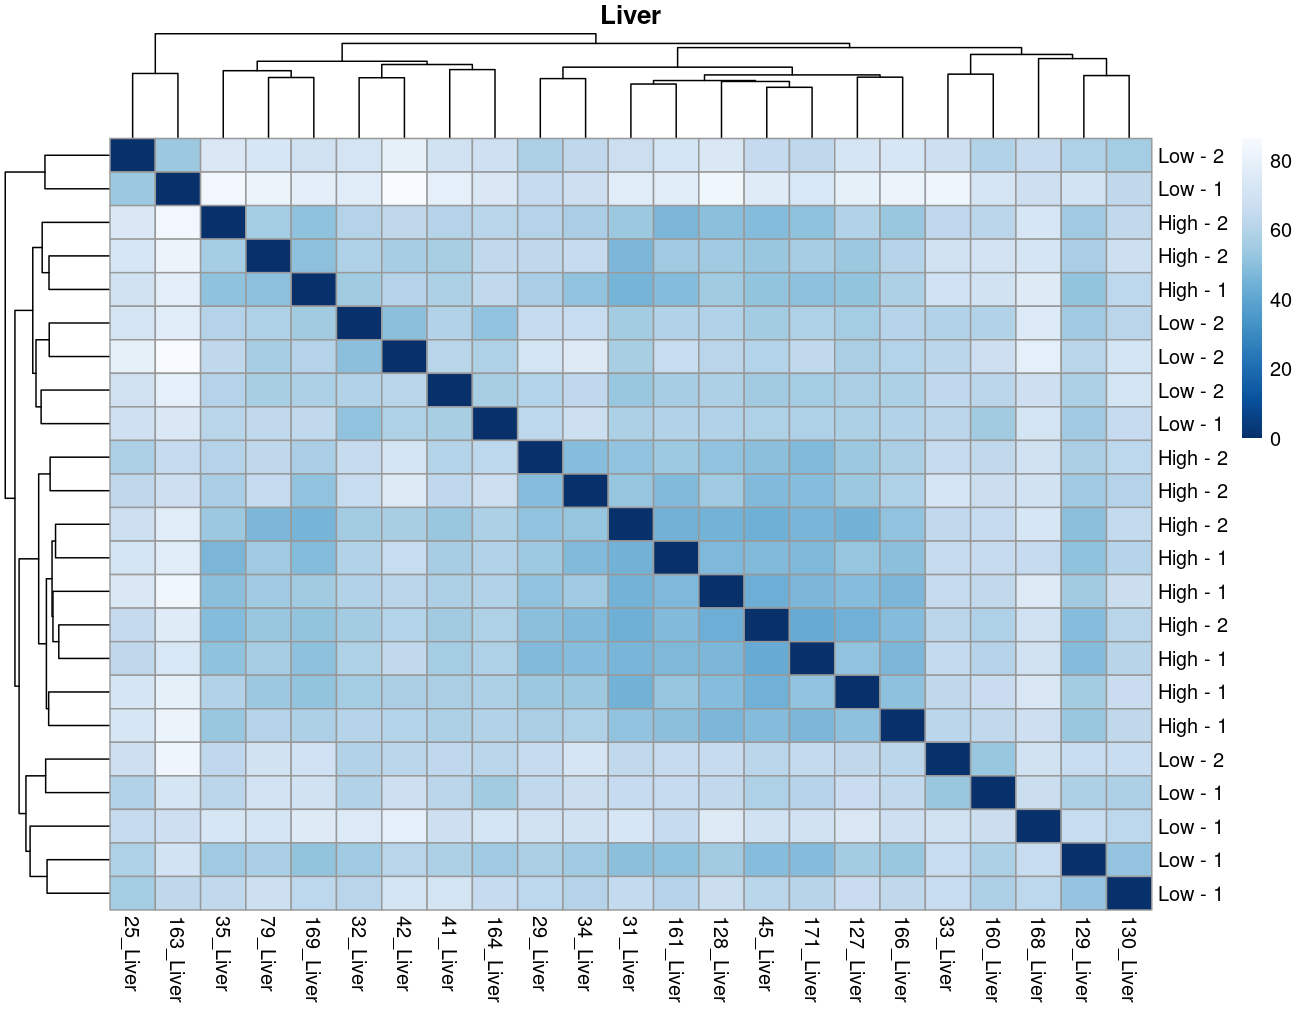


Thank you. I actually ended up running SVA (be and leek methods) on the data and reproduced the plots. In the end, there was negligible difference regardless of the number of SVs included. So yes, I think if any batch effect is there, it is weak. (I had the impression that running SVA would brute force the data to cluster by my variables of interest... clearly not.) The results of deseq2 are also reflecting the same pattern... almost no degs in muscle, plenty of degs due to trial in intestinal tissues, plenty of degs in liver due to rfi.
So considering the negligible affect SVA (as evidence of weak/no batch effect) and the deseq2 results: I think the original plot for muscle, for example, is just showing that rfi/trial not having an important affect.... normal biological processes are influencing clustering far stronger.
I now think the original plots above are not due to technical artifacts, but rather rfi/trial having less influence than normal biological processes e.g. muscle.
No, that's not what you should expect. SVA is meant to remove excess variability that is not explained by the expected groups, not force data to fulfill your preconceived notions of what the groups should be.
As Jessica already noted, there isn't much evidence for batch effects. But I do see some evidence for possible sample mis-labeling. You have some jejunum and ileum samples partying with the duodenum samples, which seems a bit suspect, given how cleanly separated the groups are. If this were my analysis I would be wondering about those.
Thanks James. The ileum sample was removed, there was other evidence of an issue with that sample (it isn't in the heatmaps), but I left in the 2 Jejunum samples. You might notice on that second PCA with the 3 intestinal tissues, even though it is a wide spread, they still cluster by trial with the other Trial 1 jejunum samples. So there is some ambiguity there. It is tempting to remove those 2 samples, but I feel like I would be cherry-picking.
I am not suggesting you should remove them, necessarily. But it's common enough in my line of work to see what look like out of place samples that end up being samples that got mis-labeled somewhere along the line. Having samples that appear to be that far out of place just makes me think sample swap, but sometimes it's just weird samples that you might have to down-weight if you were using limma-voom. I don't think that's a thing with
DESeq2though.