
Hello,
I am working with ATAC peaks: one set is from bulk (bulkpeaks) with 138,969 peaks, and another is from single-cell (scpeaks) with 276,808 peaks. I managed to convert both into GRanges objects. I am trying to assess the % of overlap between the two peak sets. I want to know 1) which peaks overlap and 2) plot a venn diagram showing how much overlap there is, prefarably showing percantages.
I have tried this from ChIPpeakAnno to find peaks that overlap at least 25%:
t1 <- findOverlapsOfPeaks(bulkpeaks, scpeaks, minoverlap = 0.25, connectedPeaks = "keepAll")
Looking at t1$mergedPeaks, which shows all the merged overlapping peaks, I get 106,485 overlapping peaks. This is a preview of the
VennCounts:
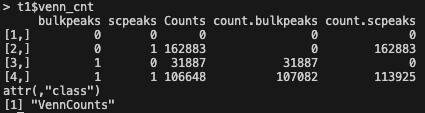
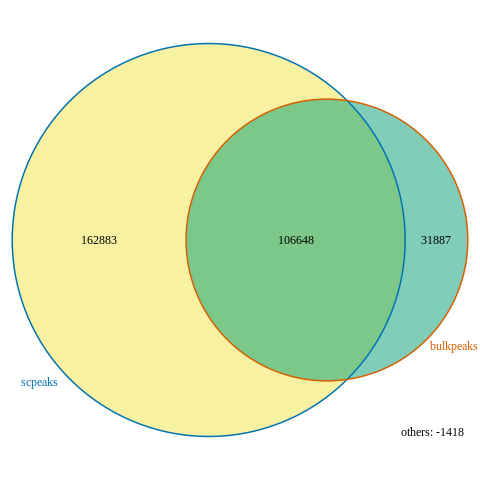
I then try to plot using makeVennDiagram using these results, and I set totalTest to be a little larger than the number of scpeaks (the larger set in this scenario) and I get a nice plot:
makeVennDiagram(t1, totalTest = 3e+5, fill = c("#009E73", "#F0E442"),
                                    col = c("#D55E00", "#0072B2"),
                                    cat.col = c("#D55E00", "#0072B2"),
                                    connectedPeaks="keepAll")
My questions are the following:
- The number of overlapping peaks seems to be 106,648 in the venn diagram, 163 more peaks than results from t1$mergedPeaks
findOverlapsOfPeaks. Why is that? And which one is the correct count of overlapping peaks? Looking at this issue, I think the last Counts fromt1$venn_cnt(which are also the value plotted in the venn diagram) is the correct count, and thet1$peaklist[["bulkpeaks///scpeaks"]]are the values after the overlapping peaks are merged. Is this correct reasoning? - I couldn't find anywhere the meaning of "others: -1418" located at the bottom right of the venn diagram figure, can someone explain this?
- Is this tool the correct one for my objective? or should I be using something else like intersect() from IRanges package? And if ChIPpeakAnno is the right way to go, is there any way I can plot the percentages of overlap?
Thank you in advance!