
Hi bioconductor community!
I have performed a DE analysis using DESeq2, with conditions being carriers vs. non-carriers of a risk allele identifed from a GWAS study. The sample size is 131 with 81 and 49 in each group. I get 18 down-regulated and 726 upregulated. The effect sizes have been shrunk by lfc. Of the up-regulated genes, the maximum logFC is 22.9 and minimum is 0.44 with mean 2.26 logFC. Of the down-regulated genes we have a range from -9.77 to -0.57 with mean -2.0 logFC.
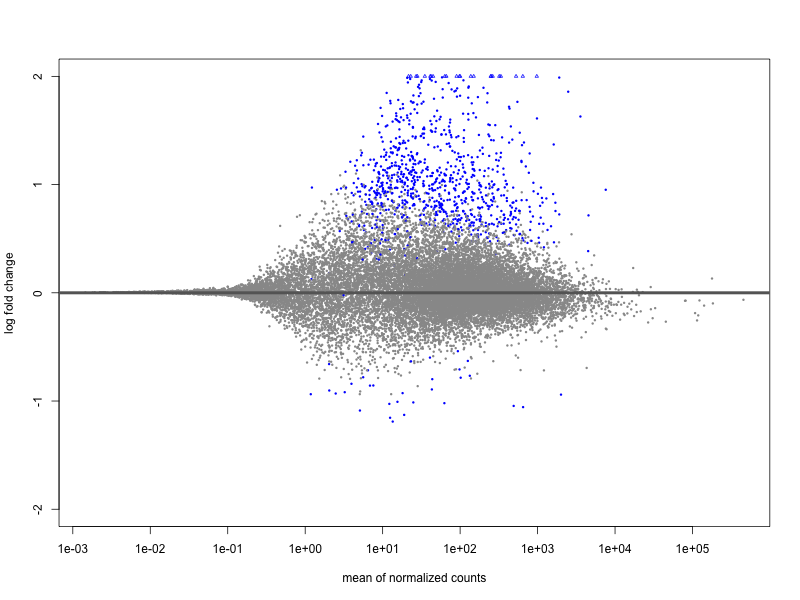
In my opinion there is no overall trend in the MA plot, but it is extremely assymetric in terms of so many upregulated genes vs. downregulated, which I think is worrying. I have performed this experiment on 20-some genetic variants using the same expression dataset, with some of the variants showing the same behaviour. However, a lot of variants have completely symmetric MA Plots. The median ratio between up/ and down-regulated genes is 0.6 meaning that there are ca. twice as many downregulated genes on average. There are some extreme outliers with 30-40 times as many upregulated, and some with 50-70 times as many downregulated genes. But most (75 %) lie within 0.14 to 3 times as many upregulated genes vs. downregulated. The number of samples in each group is not widely different among the variants. It is quite difficult to say if this is biologically meaningful, given the limited knowledge about the genetic variants in general.
I just wanted to get your opinion on the matter. Does this MA plot indicate that something is wrong with the normalization or could it be due to low sample size, or something else?
Here is my code to generate the MA plot. The levels of the genetic variants are 1: carrier or 0: non-carrier. The column is called "SNP".
    dds <- DESeqDataSetFromTximport(txi = mRNA_list,
                                    colData = coldata,
                                    design = ~ SNP + age + gender)
    dds <- DESeq(dds)
    res <- results(dds)
    res <- results(dds, contrast=c("SNP","1","0"))

    resLFC <- lfcShrink(dds, contrast=c("SNP","1","0"), type="normal")
    plotMA(resLFC, ylim=c(-2,2))

Batch effects were actually removed from the data beforehand, which is confirmed by a PCA plot. Carriers and non-carriers were not treated seperately and adjusting for population stratification (PC's) doesn't change the MA plot either.
One thing you may try is to not remove batch effects beforehand but to estimate with RUV and then pass that to DESeq2's design (see workflow for a worked out example).
But you may still see the up-regulation. I've seen plenty of experiments with imbalanced response. But I'm also asking you if it's implausible that the allele would have such an effect in this group. I'm surprised that grouping by an allele would give much DE at all, beyond a cis gene.
Anyway, you didn't mention the plotting of counts, I would certainly be doing that as well as part of QC.