Can I trust the differential expression analysis when the two groups overlap on the PCA?
1
0
Entering edit mode
@katagiryaeric-13603
Last seen 15 days ago
Uganda

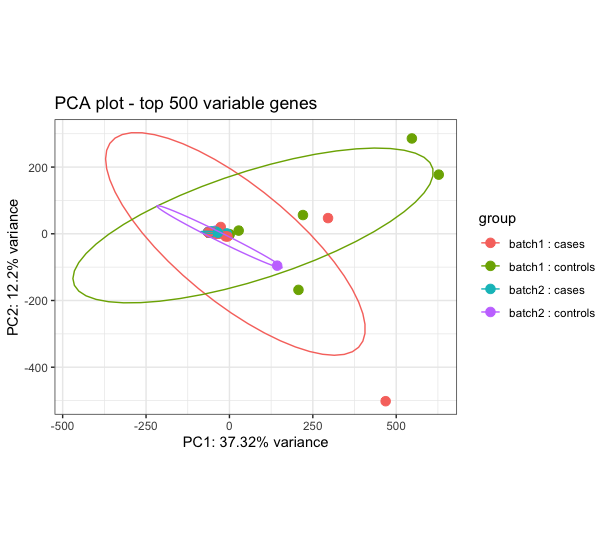
I am determining differential transcript expression and usage between cases (dually infected) and controls (single infection). I have 59 sequences with 36 cases and 23 controls. The DTE results show some signal relevant to the conditions in question, however I am constrained to trust the results because the cases and controls largely overlap on the PCA performed using rlog transformed counts (see image attached). I have performed robust PCA to try and identify outliers but it doesn't help and also used surrogate variable analysis (SVA) and combat_seq to try to adjust for hidden batch effect, but none has improved my the PCA. The challenge is pronounced when I attempt to determine Isoform switch analysis using IsoformSwitchAnalyzeR, there is no isoform switching between cases and controls. When I use visual inspection and just select 8 cases and 8 controls I get better performance and even get isoform switches. How can I best handle this issue of overlapping cases and controls?

 PCA on samples - PC1 vs PC2

DESeq2 pcaExplorer • 600 views
ADD COMMENT
0
Entering edit mode

I think I am about to run into the same issue with my data, so I'll be interested to read peoples opinions on this also i.e. when the groups don't separate no matter what you do. I have a few ideas based on the fact that the 2-dimensional PCA is only accounting for ~ 50% of the variance in 500 genes

  • Plotting a 3-D PCA (PC1:3) may help. Have you produced a scree/bi-plot?
  • Create a pairs plot (PCAtools) to see if any pair of principle components separate any of the groups.
  • Assuming you used DESeq2::plotPCA, include the ntop argument to increase the number of top variable genes to 90%.
ADD REPLY
0
Entering edit mode

Thanks BioinfGuru

  • I did the 3-D PCA plot PC1 vs PC3 plot and also the scree plot Scree plot but couldn't make much of them.
  • For the pairs plot no pairs would do well segregating the cases from controls Pairsplot.
  • I also did PCA with the top variable genes set to 90% and still didn't get better segregation although of course there was improved spacing between some samples PC1 and PC2 using top 90% Variable genes.

So as of now, I am still nearly at square one.

ADD REPLY
0
Entering edit mode

No worries, wish I could be more help. Plotly provide a 3-D plot function that's pretty simple (the two you did are still 2-D plots, they just differ in which 2 PCs are plotted) but I doubt it will make any difference here.

Just 2 more ideas:

  • I got caught out with this before. I kept scale=TRUE in the prcomp command after already scaling with rlog - it really messed up the clustering.
  • You can tell prcomp the maximal number of principal components to be used with the "rank" argument. I'm really not sure of the validity of this though.
ADD REPLY
0
Entering edit mode
@mikelove
Last seen 15 hours ago
United States

Can you use vst instead of rlog and increase to 1000 or 2000 genes?

I'm wondering if there's a way to characterize these 7 samples. How about boxplots of log10 counts + 1 per sample (raw counts, not scaled). Do these samples differ in those plots as well?

ADD COMMENT
0
Entering edit mode

Thanks Michael Love , Using vst or rlog doesn't improve the segregation nor is there a remarkable difference when I use 1000 or 2000 most variable features (transcripts). The 7 samples have nothing observable unique as far as I can see in the metadata. Their IDs are sample_8,sample_9,sample_11,sample_18,sample_23,sample_38, and sample_42 if you are to check them out on the plot of raw data. boxplots of log10 counts + 1 per sample using raw counts 
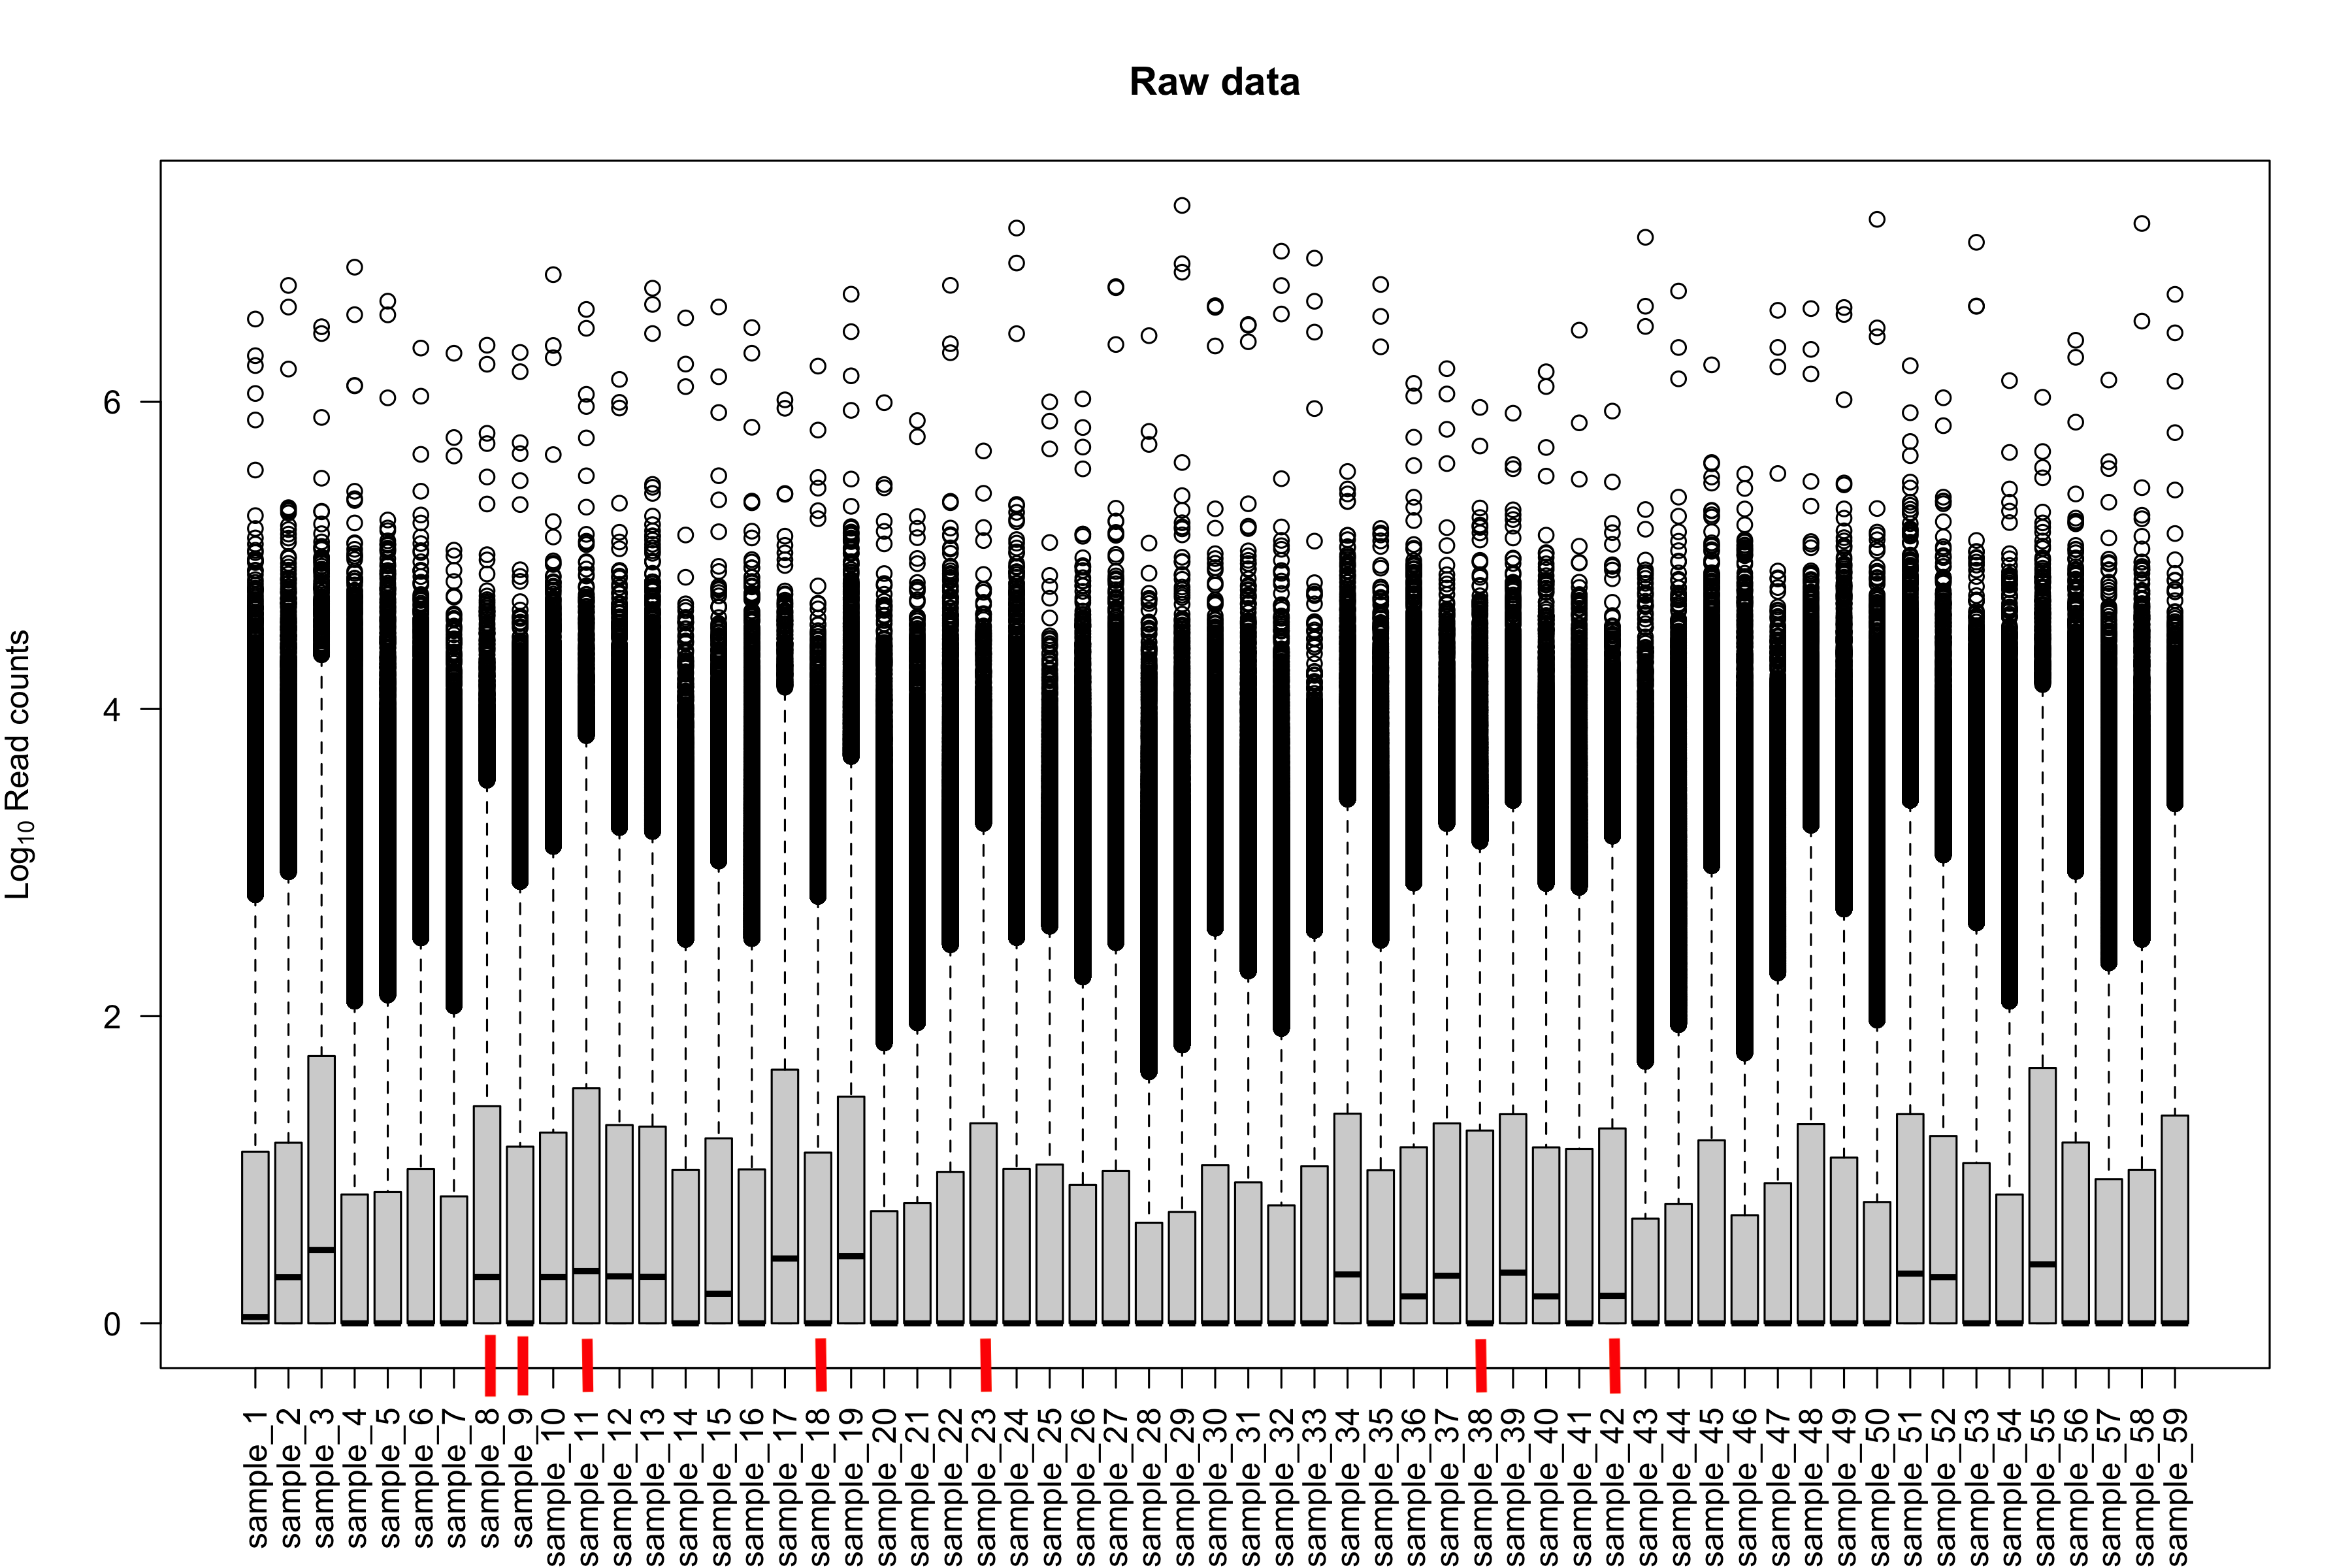
The seven samples have a red bar.

ADD REPLY
0
Entering edit mode

I'm wondering about sample table mixup.

How have you merged your sequencing data with the phenotype data (colData)?

ADD REPLY
0
Entering edit mode

I created a DESeqDataSet object using DESeqDataSetFromMatrix function. I don't anticipate any mismatching or mixup of sampleIDs.

ADD REPLY
0
Entering edit mode

If you manually compute PCA on VST data, what are the top 5 genes contributing to PC1?

https://github.com/thelovelab/DESeq2/blob/devel/R/plots.R#L251

Look into the rotations matrix of the output from prcomp. Look at the top 5 genes by absolute value of the first column of this matrix. E.g.

idx <- order(abs(x[,1]), decreasing=TRUE)
head(x[idx,])
ADD REPLY

Login before adding your answer.

Traffic: 482 users visited in the last hour
Help About
FAQ
Access RSS
API
Stats

Use of this site constitutes acceptance of our User Agreement and Privacy Policy.

Powered by the version 2.3.6