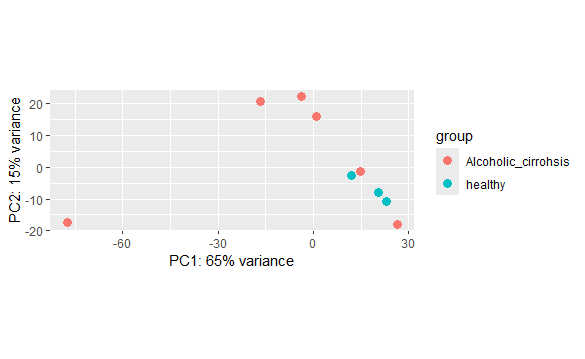
can anyone please help me with the outlier in the given results ...
summary(results)
out of 31024 with nonzero total read count adjusted p-value < 0.1 LFC > 0 (up) : 51, 0.16% LFC < 0 (down) : 233, 0.75% outliers 1 : 578, 1.9% low counts [2] : 6588, 21% (mean count < 4) 1 see 'cooksCutoff' argument of ?results [2] see 'independentFiltering' argument of ?results ...
the PCA plot of my data is as follow


