Hi!
I'm trying to plot profile and heatmap for my samples with the following meta data:
> samples
      SampleID     Tissue Factor Condition Treatment Replicate   Control_id
1 HEP152_T5B_1 HEP152_T5B  Tumor     NAFLD        NA         1 HEP152_1_INP
2 HEP152_T5B_3 HEP152_T5B  Tumor     NAFLD        NA         3 HEP152_3_INP
3 HEP152_T5B_4 HEP152_T5B  Tumor     NAFLD        NA         4 HEP152_4_INP
4     HEP262T1  HEP262_T1  Tumor     HEP_B        NA         1 HEP262T2B_IN
5     HEP262T3  HEP262_T3  Tumor     HEP_B        NA         1 HEP262T2B_IN
6  HEP268_N1_2   HEP268N1 Normal     HEP_B        NA         1  HEP268N_INP
7 HEP268_N1_L3   HEP268N1 Normal     HEP_B        NA         2  HEP268N_INP
8     HEP276_N   HEP276_N Normal     NAFLD        NA         1  HEP276N_INP
9   HEP276N_L1   HEP276_N Normal     NAFLD        NA         2  HEP276N_INP
I have previously created the following contrasts and performed dba.analyze() for the differential enrichment analysis:
dba.show(dbObj_analyzed, bContrasts = TRUE)
     Factor Group Samples Group2 Samples2 DB.DESeq2
1    Factor Tumor       5 Normal        4      5316
2 Condition HEP_B       4  NAFLD        5      5703
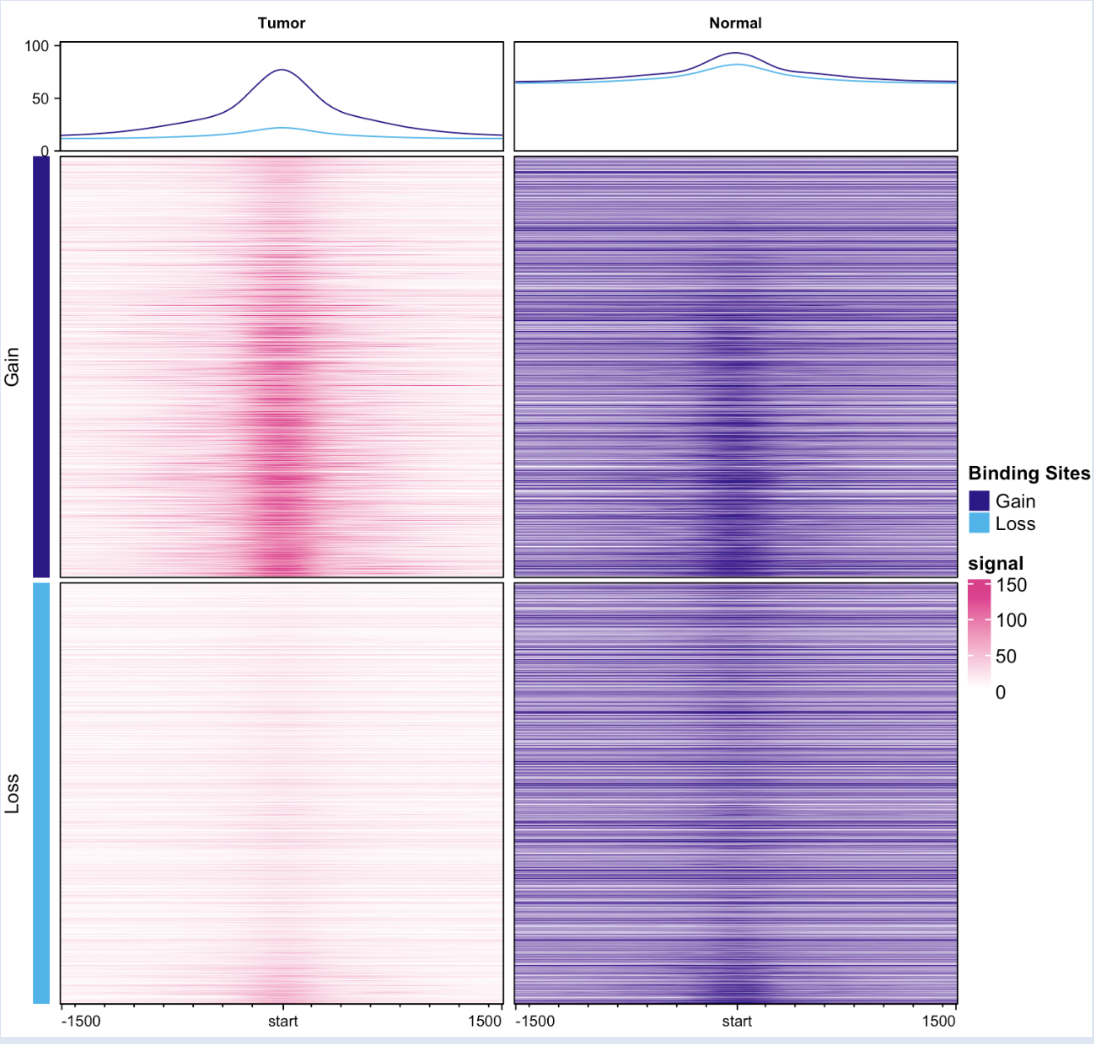
I suppose that if I wanted to present the profile plot and heatmap for tumor vs normal only, I have to merged by replicates, condition (Hep B or NAFLD), and tissue. Therefore, the plots are divided by Factor (Tumor vs normal) only, which turned out to be expected.
profile_merged_TvsN <- dba.plotProfile(dbObj_analyzed,
                                               merge=c(DBA_CONDITION,
                                                       DBA_REPLICATE,
                                                       DBA_TISSUE))
dba.plotProfile(profile_merged_TvsN)
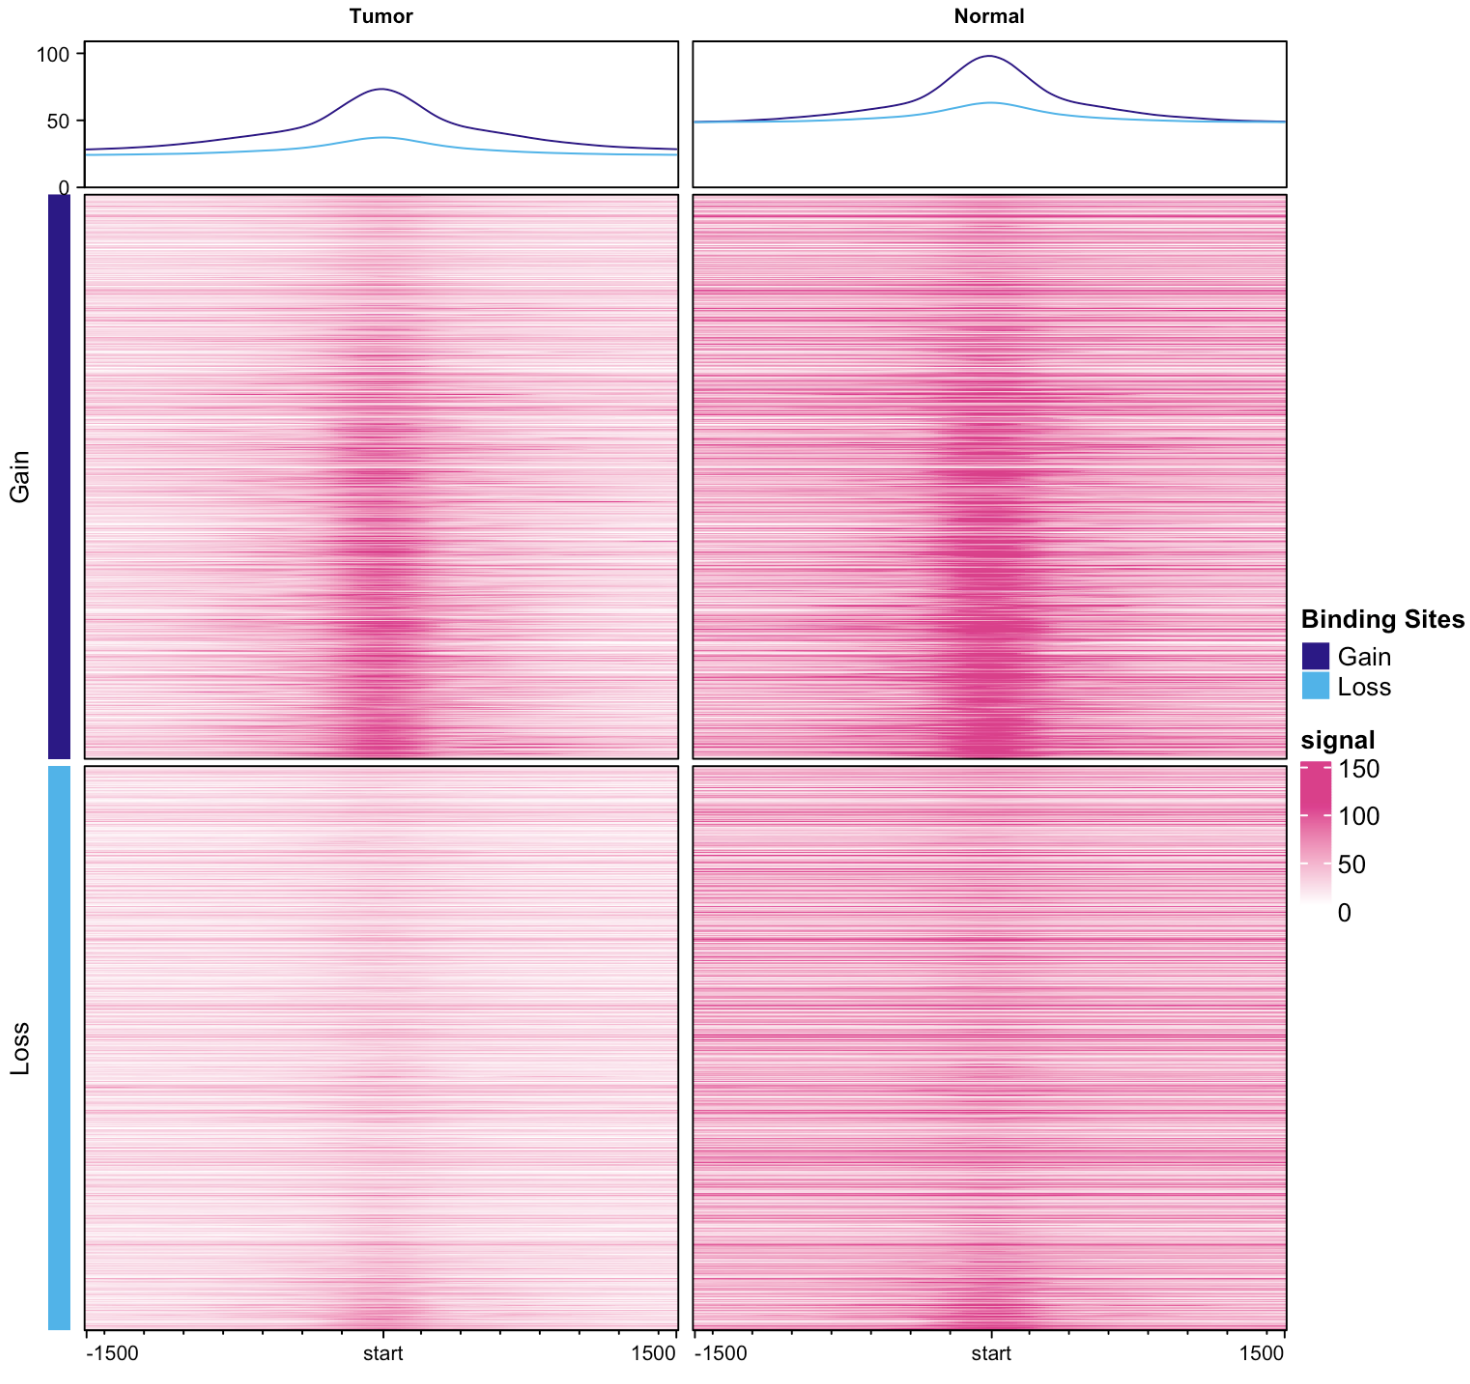
However, when I applied the same logic to present the profile plot and heatmap for HEP_B vs NAFLD only, through merging replicates, factor (tumor or normal), and Tissue, it didn't seem to work as expected.
profile_merged_cond <- dba.plotProfile(dbObj_analyzed,
                                       merge=c(DBA_FACTOR,
                                               DBA_REPLICATE,
                                               DBA_TISSUE))
dba.plotProfile(profile_merged_cond)
May I ask what happened here, and how I can fix this to show the profile plot and heatmap for HEP_B vs NAFLD only?
Also, on a side note, I am curious about the interpretation of my profile plot for Tumor vs Normal. I couldn't decipher the meaning just by reading the diffbind documentation. Here, it seems like the gain curve is above the loss curve for both the tumor and normal. Could anyone break down what each component of the plot and heatmap is saying please?
Thank you very much!
sessionInfo( )
R version 4.3.3 (2024-02-29)
Platform: aarch64-apple-darwin20 (64-bit)
Running under: macOS Sonoma 14.1.2

Matrix products: default
BLAS:   /System/Library/Frameworks/Accelerate.framework/Versions/A/Frameworks/vecLib.framework/Versions/A/libBLAS.dylib
LAPACK: /Library/Frameworks/R.framework/Versions/4.3-arm64/Resources/lib/libRlapack.dylib;  LAPACK version 3.11.0

locale:
[1] en_US.UTF-8/en_US.UTF-8/en_US.UTF-8/C/en_US.UTF-8/en_US.UTF-8

tzcode source: internal

attached base packages:
[1] stats4    stats     graphics  grDevices utils     datasets  methods   base

other attached packages:
 [1] lubridate_1.9.3             forcats_1.0.0               stringr_1.5.1
 [4] dplyr_1.1.4                 purrr_1.0.2                 readr_2.1.5
 [7] tidyr_1.3.1                 tibble_3.2.1                ggplot2_3.5.1
[10] tidyverse_2.0.0             DiffBind_3.12.0             SummarizedExperiment_1.32.0
[13] Biobase_2.62.0              MatrixGenerics_1.14.0       matrixStats_1.3.0
[16] GenomicRanges_1.54.1        GenomeInfoDb_1.38.8         IRanges_2.36.0
[19] S4Vectors_0.40.2            BiocGenerics_0.48.1

loaded via a namespace (and not attached):
  [1] fs_1.6.4                                  bitops_1.0-7
  [3] enrichplot_1.22.0                         doParallel_1.0.17
  [5] HDO.db_0.99.1                             httr_1.4.7
  [7] RColorBrewer_1.1-3                        numDeriv_2016.8-1.1
  [9] tools_4.3.3                               DT_0.33
 [11] utf8_1.2.4                                R6_2.5.1
 [13] lazyeval_0.2.2                            GetoptLong_1.0.5
 [15] apeglm_1.24.0                             withr_3.0.0
 [17] prettyunits_1.2.0                         gridExtra_2.3
 [19] preprocessCore_1.64.0                     cli_3.6.2
 [21] scatterpie_0.2.2                          SQUAREM_2021.1
 [23] mvtnorm_1.2-4                             mixsqp_0.3-54
 [25] Rsamtools_2.18.0                          yulab.utils_0.1.4
 [27] R.utils_2.12.3                            DOSE_3.28.2
 [29] plotrix_3.8-4                             BSgenome_1.70.2
 [31] invgamma_1.1                              bbmle_1.0.25.1
 [33] limma_3.58.1                              rstudioapi_0.16.0
 [35] RSQLite_2.3.6                             shape_1.4.6.1
 [37] generics_0.1.3                            gridGraphics_0.5-1
 [39] TxDb.Hsapiens.UCSC.hg19.knownGene_3.2.2   BiocIO_1.12.0
 [41] hwriter_1.3.2.1                           gtools_3.9.5
 [43] GO.db_3.18.0                              Matrix_1.6-5
 [45] interp_1.1-6                              profileplyr_1.18.0
 [47] fansi_1.0.6                               abind_1.4-5
 [49] R.methodsS3_1.8.2                         lifecycle_1.0.4
 [51] yaml_2.3.8                                edgeR_4.0.16
 [53] gplots_3.1.3.1                            qvalue_2.34.0
 [55] SparseArray_1.2.4                         BiocFileCache_2.10.2
 [57] grid_4.3.3                                blob_1.2.4
 [59] promises_1.3.0                            crayon_1.5.2
 [61] bdsmatrix_1.3-7                           lattice_0.22-6
 [63] cowplot_1.1.3                             GenomicFeatures_1.54.4
 [65] KEGGREST_1.42.0                           magick_2.8.3
 [67] ComplexHeatmap_2.18.0                     pillar_1.9.0
 [69] knitr_1.45                                soGGi_1.34.0
 [71] fgsea_1.28.0                              rjson_0.2.21
 [73] boot_1.3-30                               systemPipeR_2.8.0
 [75] codetools_0.2-20                          fastmatch_1.1-4
 [77] glue_1.7.0                                ShortRead_1.60.0
 [79] ggfun_0.1.4                               GreyListChIP_1.34.0
 [81] data.table_1.15.4                         vctrs_0.6.5
 [83] png_0.1-8                                 treeio_1.26.0
 [85] org.Mm.eg.db_3.18.0                       gtable_0.3.5
 [87] amap_0.8-19                               chipseq_1.52.0
 [89] emdbook_1.3.13                            cachem_1.0.8
 [91] xfun_0.43                                 TxDb.Mmusculus.UCSC.mm9.knownGene_3.2.2
 [93] S4Arrays_1.2.1                            mime_0.12
 [95] tidygraph_1.3.1                           coda_0.19-4.1
 [97] pheatmap_1.0.12                           iterators_1.0.14
 [99] statmod_1.5.0                             interactiveDisplayBase_1.40.0
[101] rGREAT_2.4.0                              nlme_3.1-164
[103] ggtree_3.10.1                             bit64_4.0.5
[105] progress_1.2.3                            filelock_1.0.3
[107] irlba_2.3.5.1                             KernSmooth_2.23-22
[109] colorspace_2.1-0                          DBI_1.2.2
[111] DESeq2_1.42.1                             tidyselect_1.2.1
[113] bit_4.0.5                                 compiler_4.3.3
[115] curl_5.2.1                                xml2_1.3.6
[117] TxDb.Mmusculus.UCSC.mm10.knownGene_3.10.0 DelayedArray_0.28.0
[119] shadowtext_0.1.3                          rtracklayer_1.62.0
[121] scales_1.3.0                              caTools_1.18.2
[123] ChIPseeker_1.38.0                         rappdirs_0.3.3
[125] tiff_0.1-12                               digest_0.6.35
[127] rmarkdown_2.26                            XVector_0.42.0
[129] htmltools_0.5.8.1                         pkgconfig_2.0.3
[131] jpeg_0.1-10                               dbplyr_2.5.0
[133] fastmap_1.1.1                             GlobalOptions_0.1.2
[135] rlang_1.1.3                               htmlwidgets_1.6.4
[137] shiny_1.8.1.1                             EnrichedHeatmap_1.32.0
[139] farver_2.1.1                              jsonlite_1.8.8
[141] BiocParallel_1.36.0                       R.oo_1.26.0
[143] GOSemSim_2.28.1                           RCurl_1.98-1.14
[145] magrittr_2.0.3                            GenomeInfoDbData_1.2.11
[147] ggplotify_0.1.2                           patchwork_1.2.0
[149] munsell_0.5.1                             Rcpp_1.0.12
[151] ape_5.8                                   viridis_0.6.5
[153] stringi_1.8.3                             ggraph_2.2.1
[155] zlibbioc_1.48.2                           MASS_7.3-60.0.1
[157] org.Hs.eg.db_3.18.0                       AnnotationHub_3.10.1
[159] plyr_1.8.9                                parallel_4.3.3
[161] ggrepel_0.9.5                             deldir_2.0-4
[163] Biostrings_2.70.3                         graphlayouts_1.1.1
[165] splines_4.3.3                             circlize_0.4.16
[167] hms_1.1.3                                 locfit_1.5-9.9
[169] igraph_2.0.3                              reshape2_1.4.4
[171] biomaRt_2.58.2                            BiocVersion_3.18.1
[173] XML_3.99-0.16.1                           evaluate_0.23
[175] latticeExtra_0.6-30                       BiocManager_1.30.22
[177] foreach_1.5.2                             tzdb_0.4.0
[179] tweenr_2.0.3                              httpuv_1.6.15
[181] polyclip_1.10-6                           clue_0.3-65
[183] ashr_2.2-63                               ggforce_0.4.2
[185] xtable_1.8-4                              restfulr_0.0.15
[187] tidytree_0.4.6                            later_1.3.2
[189] viridisLite_0.4.2                         TxDb.Hsapiens.UCSC.hg38.knownGene_3.18.0
[191] truncnorm_1.0-9                           aplot_0.2.2
[193] memoise_2.0.1                             AnnotationDbi_1.64.1
[195] GenomicAlignments_1.38.2                  cluster_2.1.6
[197] timechange_0.3.0


Hello, Did you ever manage to figure this out?