enrichGOgradient color change
2
0
Entering edit mode
inna.gur • 0
@9688cd82
Last seen 11 months ago
Israel

Hi all,

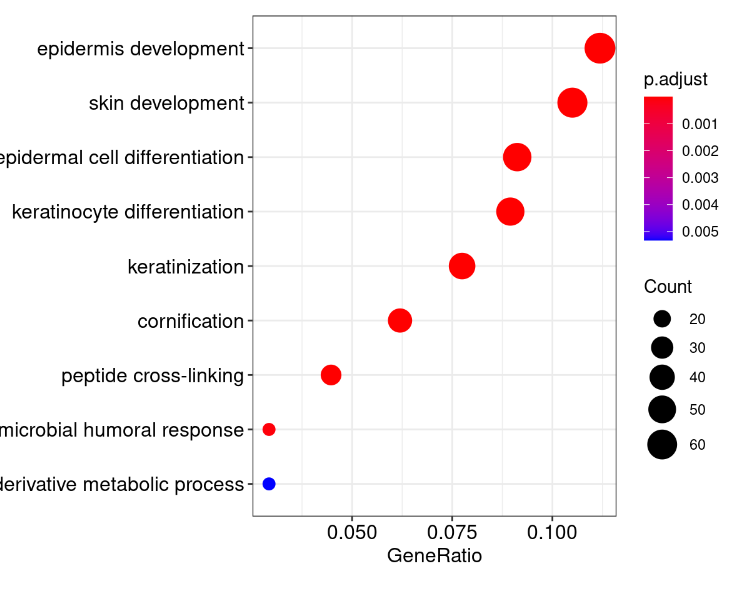
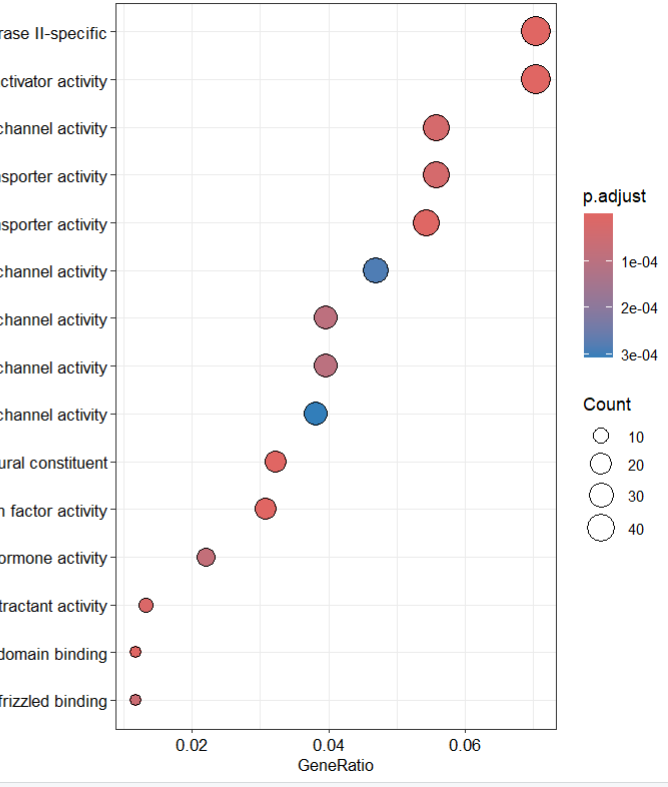
For the past month the gradient colors of the Dotplot following EnrichGO (clusterProfiler) have changed. Instead of bright red to blue/purple, its pale red/ orange and strange blue.

I didn't change the code, just using the standard dotplot(ego2, color="p.adjust") How can I fix it and return to the older bright colors.

Thanks

older version

new version

clusterProfiler • 4.4k views
ADD COMMENT
1
Entering edit mode
@james-w-macdonald-5106
Last seen 16 minutes ago
United States

Set the colors first.

options(enrichplot.colours = c("red","blue"))
dotplot(ego2)
ADD COMMENT
0
Entering edit mode

Amazing :) It worked. Thank you!

ADD REPLY
0
Entering edit mode

I would like to ask how to make the counts legend black. Thank you.

ADD REPLY
0
Entering edit mode

You could look at my answer and extrapolate from there.

ADD REPLY
0
Entering edit mode

Dear James, I am faced with the same issue as above, i.e. a black line round the dots and lack of black fill in the count-circles. I have searched for an answer and read the enrichplot package description, but I am unable to find the list of parameters I can change using your suggestions, nor have I been able to extrapolate from your example. Any chance you could provide some additional assistance? Thanks.

ADD REPLY
0
Entering edit mode

facing same issue here... cannot change the dotplot color legend from black to white.. any help ion this?

ADD REPLY
0
Entering edit mode
Guido Hooiveld ★ 4.1k
@guido-hooiveld-2020
Last seen 7 hours ago
Wageningen University, Wageningen, the …

A more detailed explanation has been posted on the GitHub of clusterProfiler: https://github.com/YuLab-SMU/enrichplot/issues/268

Also these threads/posts may be of relevance: https://github.com/YuLab-SMU/clusterProfiler/issues/667#issuecomment-1953867201 (refers also to color scale in cnetplot (enrichplot) is not centered in 0, skewed towards positive values).

ADD COMMENT
0
Entering edit mode

Is it possible in some way to get it done in the same code, something like this (it doesn't work):

clusterProfiler::dotplot(ego, showCategory=15) + theme(axis.text.y = element_text(size=8)) + scale_color_gradient(low = "green", high = "red")

ADD REPLY

Login before adding your answer.

Traffic: 1246 users visited in the last hour
Help About
FAQ
Access RSS
API
Stats

Use of this site constitutes acceptance of our User Agreement and Privacy Policy.

Powered by the version 2.3.6