Hi,
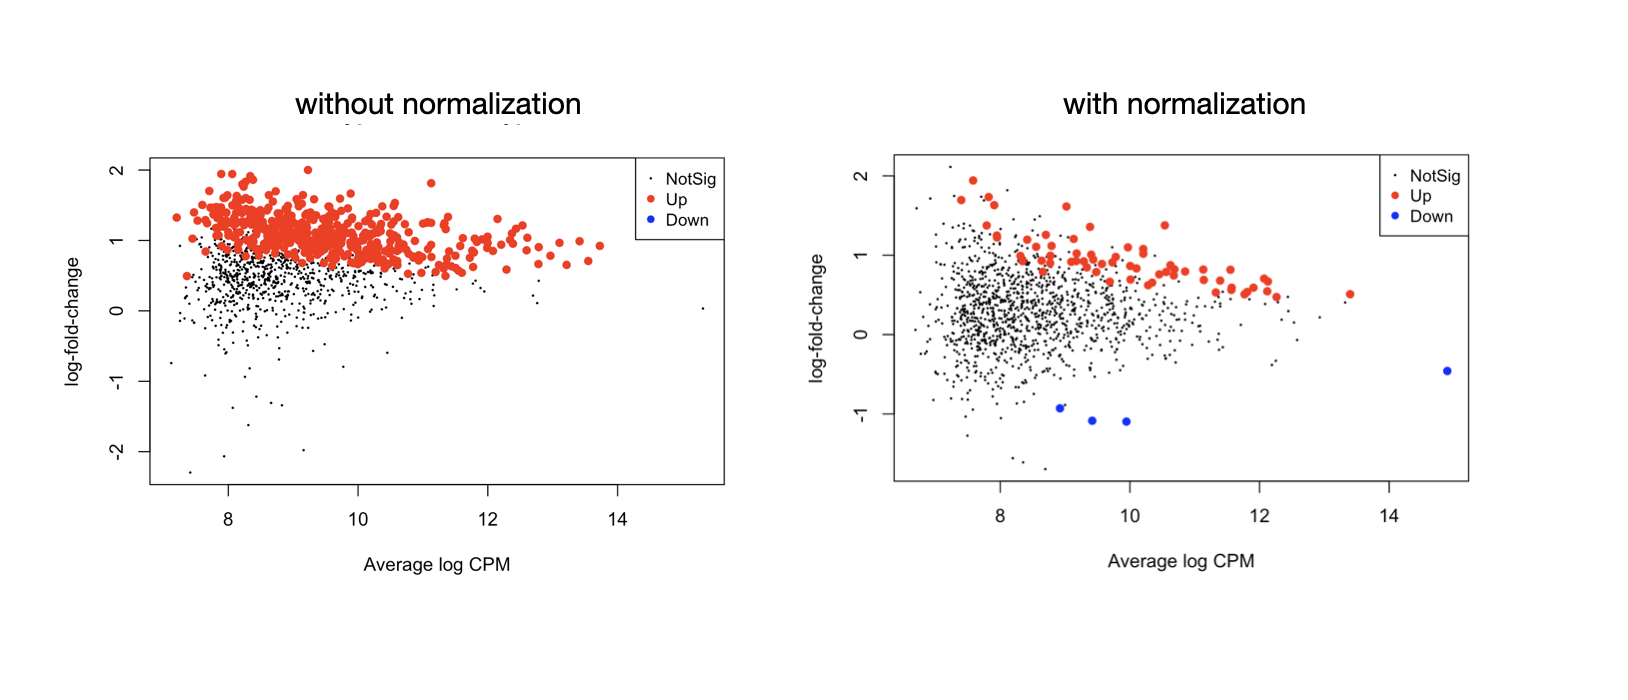
Following my previous question about edgeR methylation analysis. I noticed that in my dataset the library size between each group (cell type) is very imbalanced so it's better to normalize them, unlike the tutorial which doesn't implement the normalization for RRBS count data, see the MD plots -
this is one celltype (MPP1) vs another celltype (MPP2), if it's one-vs-others, it'll be a little different
> y$samples
             group lib.size norm.factors
samp1.MPP1-Me      1  19245.0            1
samp1.MPP1-Un      1  19245.0            1
samp1.MPP2-Me     1  82277.0            1
samp1.MPP2-Un     1  82277.0            1
samp2.MPP1-Me      1  19431.5            1
samp2.MPP1-Un      1  19431.5            1
samp2.MPP2-Me     1  73977.5            1
samp2.MPP2-Un     1  73977.5            1
after y <- normLibSizes(y) I got
> y$samples
             group lib.size norm.factors
samp1.MPP1-Me      1  19245.0    0.2998637
samp1.MPP1-Un      1  19245.0    2.8625168
samp1.MPP2-Me     1  82277.0    0.3777328
samp1.MPP2-Un     1  82277.0    2.4680322
samp2.MPP1-Me      1  19431.5    0.5204971
samp2.MPP1-Un      1  19431.5    2.4482510
samp2.MPP2-Me     1  73977.5    0.7231264
samp2.MPP2-Un     1  73977.5    1.9707319
I got quite a different set of differential methylation sites after library size normalization, but it seems to make more sense than before, I wonder if this is the right way to do the normalization... thank you.


oh? but here what I want to do is normalize counts from different celltypes, i.e. total counts from MPP1 and MPP2, not the Me and Un counts. like in the question lib.size is the same for Me and Un counts of one celltype in one sample, is it still not doable?
Please follow the workflow examples, which guide you through a methylation analysis from start to finish. The workflow already fully takes account of differing library sizes as part of the analysis. The
lib.sizevalues are actually irrelevant because the library size adjustment is done as part of the linear model.The workflow tells you that "Other normalization methods developed for RNA-seq data, such as TMM, are not required for BS-seq data".
The worfkow also says "the two library sizes for each sample should be equal. Otherwise, the library size values are arbitrary and any settings would lead to the same P-value."
I did follow the workflow and have the result showing in the left MD plot, where the sites's logFC values center around 1 not 0. This seems strange and seems like the differential test didn't account for celltype frequency. MPP2 has a higher global methylation frequency than MPP1, the contrast is MPP2-MPP1. We want to look for differential sites that are not just from celltype-specific methylation activities
If you would like help with your analysis, please start a new question in which you explain the experimental design and show the code that you have used. It might be that there is simple mistake in the analysis leading to the unexpected logFC values.
The problem is certainly not to do with library size normalization, so continuing this question here is not helpful.
Okay I've posted it here Strange logFC values in differential methylation site anslysis
For more information: Library size normalization in methylation count analysis geometry dash