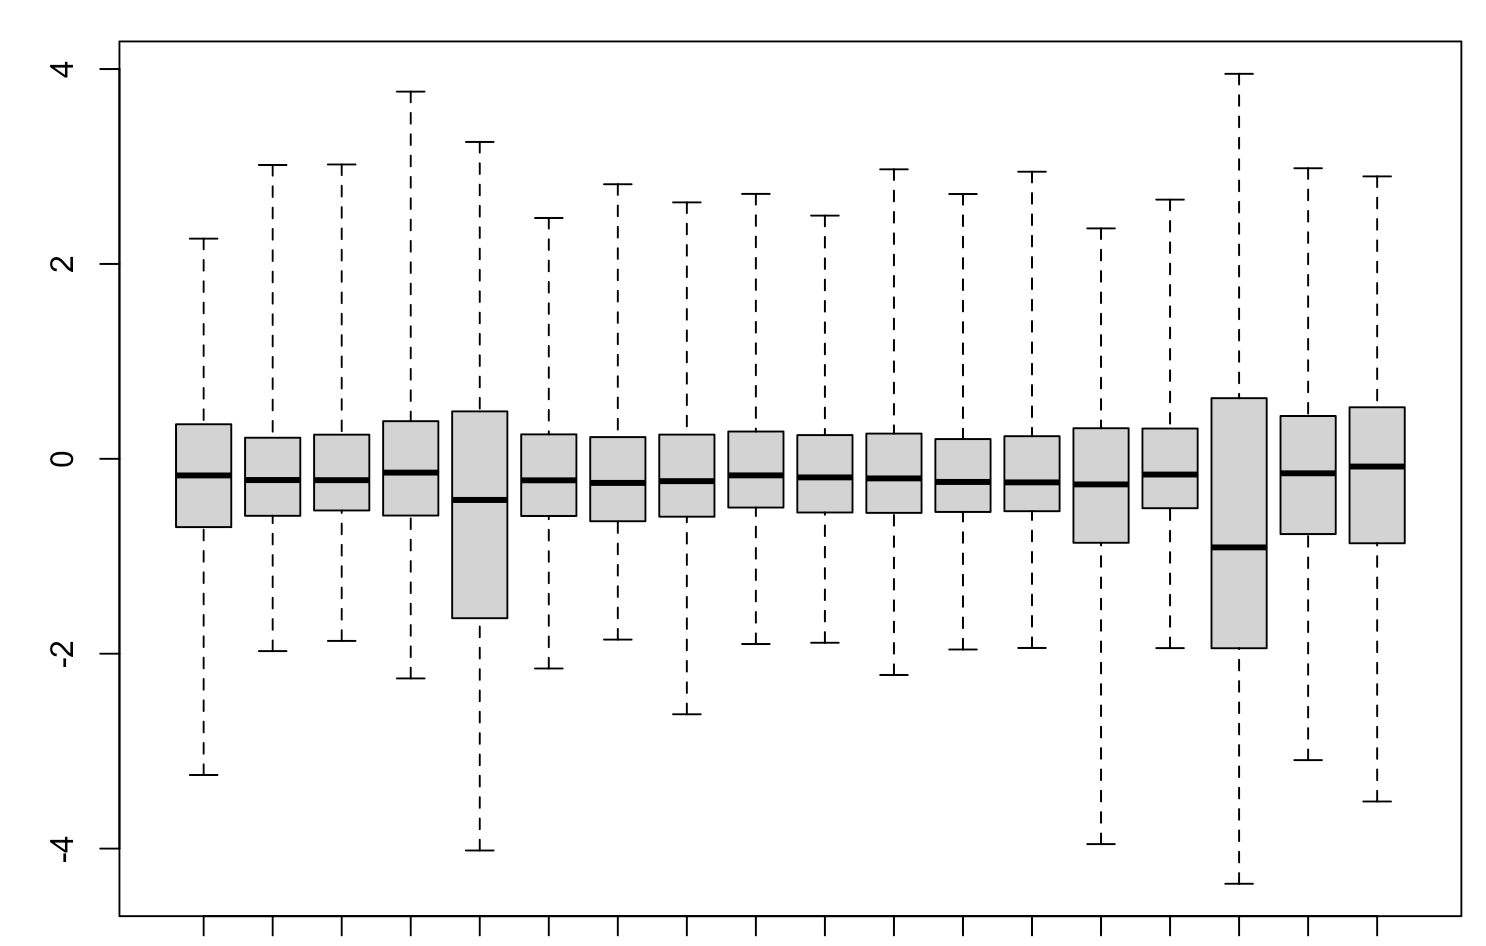
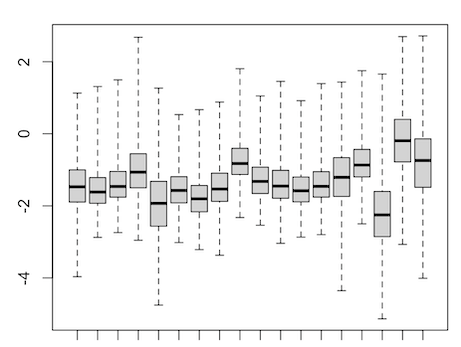
Extending my previous question -
I have a single-cell methylation dataset (7 samples and 18 celltypes) and am identifying differentially methylated sites across cell types. Different cell types have different global methylation frequencies due to biological and technical factors. I basically followed the steps in edgeR tutorial and the f1000 paper, however the results (particularly the logFC) look weird. Here is what I did:
1 load files
yall <- readBismark2DGE(file.df$file, sample.names=file.df$sample)

chr.names <- paste0('chr', c(1:19,"X","Y"))
yall$genes$Chr <- factor(yall$genes$Chr, levels=chr.names)
o <- order(yall$genes$Chr, yall$genes$Locus)
yall <- yall[o,]
2 filter and normalize
samples <- paste0("samp", c(1:7))
samp.celltypes <- expand.grid(samples, celltypes)
samp.celltypes <- paste(samp.celltypes$Var1, samp.celltypes$Var2, sep=".")
samp.ct.coverage <- lapply(samp.celltypes, function(samp) {
  rowSums(yall$counts[, grepl(samp, colnames(yall))])
})
samp.ct.coverage <- do.call(cbind, samp.ct.coverage)
colnames(samp.ct.coverage) <- samp.celltypes

has.coverage <- rowSums(samp.ct.coverage >= 8) >= 3*length(celltypes) # in at least 3 samples...
table(has.coverage)
# has.coverage
# FALSE  TRUE
# 10698  1307

# make lib.size eqaul in each sample_celltype's Me and Un
y <- yall[has.coverage, , keep.lib.sizes=FALSE]
me <- gl(2, 1, ncol(yall), labels=c("Me","Un"))
total.libsize <- 0.5 * y$samples$lib.size[me=="Me"] +
    0.5 * y$samples$lib.size[me=="Un"]
y$samples$lib.size <- rep(total.libsize, each=2)
3 construct design matrix and fit
design0 <- model.matrix(~0 + celltype + sample0, data=file.df)
design <- modelMatrixMeth(design0)

y <- estimateDisp(y, design=design, trend="none")
# y$common.dispersion
# [1] 0.01661841
summary(y$prior.df)
#   Min. 1st Qu.  Median    Mean 3rd Qu.    Max.
#   Inf     Inf     Inf     Inf     Inf     Inf

fit1 <- glmQLFit(y, design, robust=TRUE, prior.count=2)
file.df is like
head(file.df,1)
      sample                              file sample0 celltype batch sex
1 samp1.cDCP edgeR/inputs/samp1.cDCP.cov.txt.gz   samp1     cDCP     1   F
4 then do the QLFtest
compute_qlf <- function(fit, celltypes, design) {
  n.clusters <- length(celltypes)
  w.oths <- 1 / (1-n.clusters)
  qlf <- list()
  for (celltype in celltypes) {
    print(celltype)
    # initiate contrast matrix using random celltypes
    contr <- makeContrasts(
      celltype_i = celltypeCyc_Prog1 - celltypeCyc_Prog2, levels = design
    )
    # 1 vs others
    contr[grepl("celltype", rownames(contr)),] <- 0
    contr[rownames(contr) %in% paste0("celltype", celltypes),] <- w.oths
    contr[rownames(contr)==paste0("celltype", celltype)] <- 1
    print(contr)
    qlf[[celltype]] <- glmQLFTest(fit, contrast=contr)
    qlf[[celltype]]$comparison <- paste0(celltype, "_vs_others")
    plotMD(qlf[[celltype]])
  }
  qlf
}

site.qlf <- compute_qlf(fit1, celltypes, design)
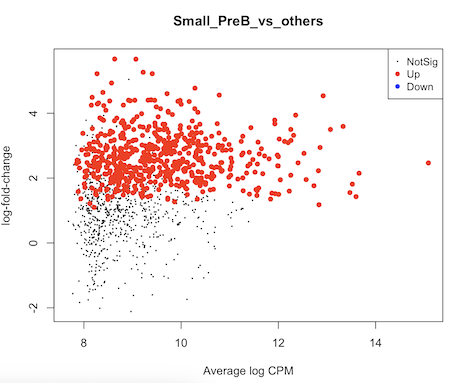
It seems to me that the test didn't account for celltype-specific methylation activity. For example in this MD plot, small preB cells in general have higher methylation frequency compared to others, but their logFCs shift to positive direction as well. Is there any mistake in my code? Or are there suggestions to run some diagnoses/sanity checks? thank you very much.


It's pretty hard to interpret or debug your
compute_qlffunction. It's pretty hard to tell what contrast you are testing. Could you not make it a little easier for us?uhm it's similar to the makeContrast code in the pseudobulk single cell example in edgeR tutorial
one of my example is
There are 18 celltypes here,
-0.05882353is from -1/17actually in my case, if I didn't set the lib.size for Me and Un to be the same, the logFC values look fine
Yes, of course, because you are forcing all the log-ratios of methylation to be about zero, without regard to the actual data. As I have told you before, you are not even measuring methylation anymore.