threshold to filter lowly expressed genes
1
0
Entering edit mode
@myprogramming2016-9741
Last seen 7.6 years ago

Hello,

I would like to use edgeR for differential Gene expression analysis. 

I have read counts data on 50 individuals in three biological replicates.

I would like to filter out lowly expressed genes. Is there a threshold to define express genes?  

I was thinking to use CPM of >=2, and it should be in two of the three libraries.

How do I define R code?

Secondly, I would like to output TMM normalized counts to identify uniquely expressed genes in each of the individuals. How do I output the TMM counts in CPM?

Thanks in advance


edger rnaseq • 11k views
ADD COMMENT
0
Entering edit mode

Thanks for sharing an updated workflow. It is very helpful.

Secondly, I do not have a group (control Vs treated). I would like to identify differentially expressed genes in a particular individual compared with a mean of all the individuals (Intercept). I would like to repeat it for all the individuals.

I was wondering if there is any tutorial or an R script.

Thanks


ADD REPLY
0
Entering edit mode

Could you please reply to my post?

Thanks

ADD REPLY
4
Entering edit mode
@gordon-smyth
Last seen 2 hours ago
WEHI, Melbourne, Australia

The section called "Filtering to remove low counts" in the workflow article

   https://f1000research.com/articles/5-1438/v2

gives a clear rule of thumb for filtering that you could apply in your situation.

ADD COMMENT
0
Entering edit mode

I think that the current wording is confusing. The explanation states "This ensures that a gene will be retained if it is expressed in both the libraries belonging to any of the six groups.". I read this as the two samples will belong to the same class, whereas the filtering is independent of samples' classes and the two samples with sufficient reads could belong to two different classes.

ADD REPLY
1
Entering edit mode

The form of the quoted sentence is "if A then B", but you are reading it to mean "if B then A".

You're not the first person to make the same interpretation, so I guess that making the reasoning longer and even more explicit may have been worthwhile. I'm always surprised by how much confusion the issue of filtering causes. However we are not planning to make changes to this published article. Making changes would require the whole article to be re-refereed.

ADD REPLY
0
Entering edit mode

Indeed, after reading it again, I noticed that I interpreted it incorrectly.

ADD REPLY
0
Entering edit mode

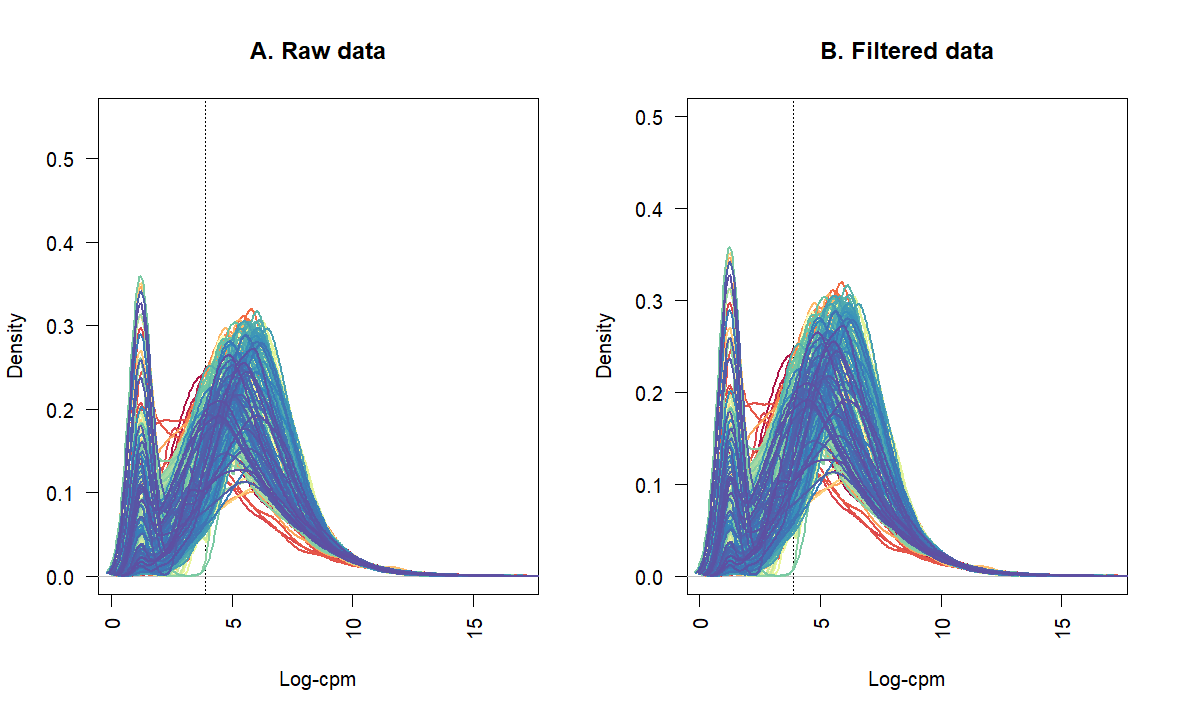
How can I asses the performance of the filtering process? I plotted the raw data and the filtered data and it seems there is no change. enter image description here

cpm <- cpm(dge)
lcpm <- cpm(dge, log=TRUE)
L <- mean(dge$samples$lib.size) * 1e-6
M <- median(dge$samples$lib.size) * 1e-6
c(L, M)
lcpm.cutoff <- log2(10/M + 2/L)
library(RColorBrewer)
nsamples <- ncol(dge$counts)
col <- brewer.spectral(nsamples)
par(mfrow=c(1,2))
plot(density(lcpm[,1]), col=col[1], lwd=2, ylim=c(0,0.55), las=2, main="", xlab="")
title(main="A. Raw data", xlab="Log-cpm")
abline(v=lcpm.cutoff, lty=3)
for (i in 2:nsamples){
den <- density(lcpm[,i])
lines(den$x, den$y, col=col[i], lwd=2)
}


##FilterbyExpr
keep.exprs <- filterByExpr(dge, group = dge$samples$group)
dge <- dge[keep.exprs,, keep.lib.sizes=FALSE]
dim(dge)

lcpm <- cpm(dge, log=TRUE)
plot(density(lcpm[,1]), col=col[1], lwd=2, ylim=c(0,0.5), las=2, main="", xlab="")
title(main="B. Filtered data", xlab="Log-cpm")
abline(v=lcpm.cutoff, lty=3)
for (i in 2:nsamples){
den <- density(lcpm[,i])
lines(den$x, den$y, col=col[i], lwd=2)
}
ADD REPLY

Login before adding your answer.

Traffic: 544 users visited in the last hour
Help About
FAQ
Access RSS
API
Stats

Use of this site constitutes acceptance of our User Agreement and Privacy Policy.

Powered by the version 2.3.6