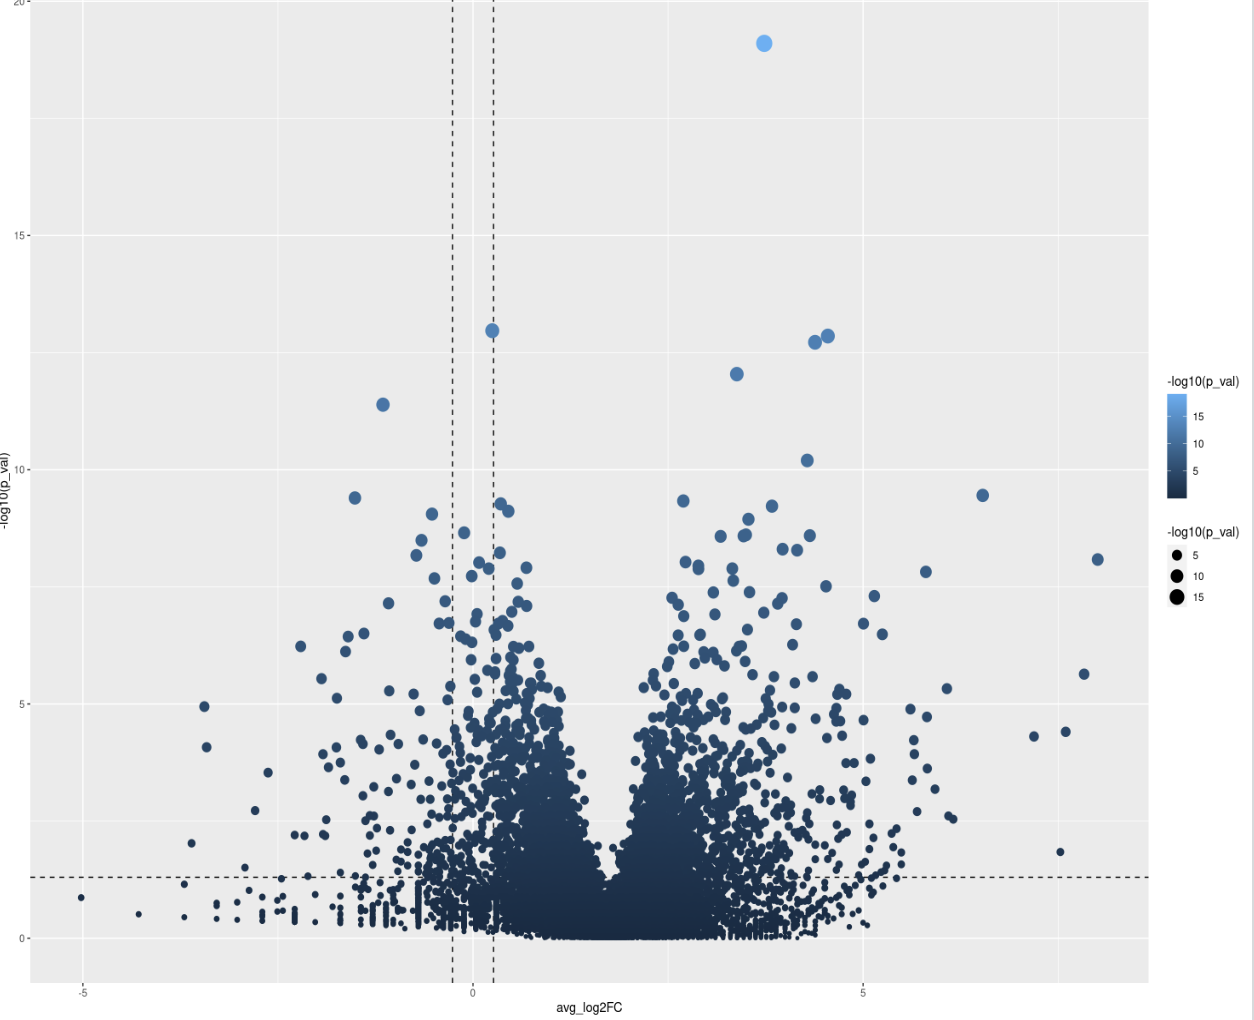
weird volcano plot
2
0
Entering edit mode
shouzheng ▴ 10
@89166a02
Last seen 12 months ago
Australia

Did anybody meet the same problem when drawing a volcano plot, with no adjustment to theme()

DESeq2 • 1.3k views
ADD COMMENT
2
Entering edit mode

Please show code and write down some context. Is this single-cell data? Basic forum etiquette demands that you not just put a plot with nothing else at all.

ADD REPLY
1
Entering edit mode

I'm sorry, this is the first time for me to post a question in bioconductor forum, so I'm not quite familiar with the rule, just wanna ask for some help here. I appreciate for your kind suggestion. My code shows as follows. I want to find the DE genes in epithelial between two different states: healthy and periodontitis. But ,the result is quite weird, I've got that this could be caused by false average log2FC value. So, how to tackle this problem? Thanks a lot!

    bulk <- AggregateExpression(oral_harmony, return.seurat = T, slot = "counts", assays = "RNA", group.by =  c("seurat_annotations", `enter code here` "orig.ident", "group"))
    tail(Cells(bulk))
    bulk$celltype <- sapply(strsplit(Cells(bulk), split = "_"), "[", 1)
    bulk$donor <- sapply(strsplit(Cells(bulk), split = "_"), "[", 2)
    bulk$group <- ifelse(grepl("^GM", bulk$donor), "HC", "PD")
    bulk$group <- factor(x = bulk$group, levels = c("HC", "PD"))
Epithelial.bulk <- subset(bulk, celltype == "Epithelial")
Idents(Epithelial.bulk) <- "group"
Epithelial_de_markers <- FindMarkers(Epithelial.bulk, ident.1 = "HC", ident.2 = "PD", slot = "counts", test.use = "DESeq2",
                                     verbose = F)
Epithelial_de_markers$gene <- rownames(Epithelial_de_markers)
Epithelial_de_markers<-na.omit(Epithelial_de_markers)
Epithelial_de_markers<-Epithelial_de_markers[!duplicated(Epithelial_de_markers$gene),] 
log2FC = 1.2
padj = 0.05
Epithelial_de_markers$threshold="stable";
Epithelial_de_markers[which(Epithelial_de_markers$avg_log2FC  > log2FC & Epithelial_de_markers$p_val <padj),]$threshold="up";
Epithelial_de_markers[which(Epithelial_de_markers$avg_log2FC  < (-log2FC) & Epithelial_de_markers$p_val < padj),]$threshold="down";
Epithelial_de_markers$threshold=factor(Epithelial_de_markers$threshold, levels=c('down','stable','up'))
FC = 1.2
padj = 0.05
Epithelial_de_markers$label=ifelse(Epithelial_de_markers$p_val < PvalueLimit & Epithelial_de_markers$avg_log2FC >= FCLimit, as.character(Epithelial_de_markers$gene), '')
ggplot(Epithelial_de_markers, aes(x = avg_log2FC, y = -log10(p_val))) +
  geom_hline(yintercept = -log10(0.05), linetype = 2) +
  geom_vline(xintercept = c(-log2(1.2), log2(1.2)), linetype = 2) +
  geom_point(aes(color = -log10(p_val), size = -log10(p_val))) +
  scale_color_gradientn( values = seq(0,1,0.2),
                         colors = c("#5E4FA2", "#3288BD", "#66C2A5",
                                    "#ABDDA4", "#E6F598", "#FFFFBF", "#FEE08B", "#FDAE61", "#F46D43",
                                    "#D53E4F", "red", "#9E0142")) +
  scale_size_continuous(range = c(1, 6)) +
  labs(title = "", x = "average_log2FC", y = "-log10_p_value") +
  geom_text_repel(data = Epithelial_de_markers, aes(label = NA, size = 20, vjust=1.5, hjust= 1, color = -log10(p_val_adj)),
                  max.overlaps = 10000, size = 7, box.padding = unit(0.5, 'lines'),
                  point.padding = unit(0.1, 'lines'), show.legend = FALSE) +
  theme_bw()+
  theme(panel.grid = element_blank(),
        legend.position = c(0.01, 0.7),
        legend.justification = c(0, 1),
        rect = element_rect(linewidth = 2),
        axis.text = element_text(size = 20), 
        axis.title = element_text(size = 20),  
        axis.text.x = element_text(size = 20),  
        axis.text.y = element_text(size = 20)) + 
  scale_x_continuous(limits = c(-8, 8), breaks = seq(-8, 8, by = 4)) +  
  scale_y_continuous(limits = c(0, 30), breaks = seq(0, 30, by = 5)) + 
  guides(col = guide_colorbar(title = "-log10_p_value"),
         size = "none")


#fibroblast
fibroblast_volcanoplot <- ggplot(Fibroblast_de_markers, aes(x = avg_log2FC, y = -log10(p_val))) +
  geom_hline(yintercept = -log10(0.05), linetype = 2) +
  geom_vline(xintercept = c(-log2(1.2), log2(1.2)), linetype = 2) +
  geom_point(aes(color = -log10(p_val), size = -log10(p_val))) +
  scale_color_gradientn( values = seq(0,1,0.2),
                         colors = c("#5E4FA2", "#3288BD", "#66C2A5",
                                   "#ABDDA4", "#E6F598", "#FFFFBF", 
                                   "#FEE08B", "#FDAE61", "#F46D43",
                                   "#D53E4F", "red", "#9E0142")) +
  scale_size_continuous(range = c(2, 10)) +
  labs(title = "", x = "average_log2FC", y = "-log10_p_value") +
  geom_text_repel(data = Fibroblast_geneList1,
                  aes(label = label, size = 30,
                  fontface = "bold",
                  color = -log10(p_val_adj)),
                  max.overlaps = 10000, 
                  size = 7, 
                  box.padding = unit(0.5, 'lines'),
                  show.legend = FALSE,
                  nudge_x = 1,
                  nudge_y=1) +
  theme_bw()+
  theme(panel.grid = element_blank(),
        legend.position = c(0.01, 0.7),
        legend.justification = c(0, 1),
        rect = element_rect(linewidth = 2),
        axis.text = element_text(size = 20), 
        axis.title = element_text(size = 20), 
        axis.text.x = element_text(size = 20),  
        axis.text.y = element_text(size = 20)) + 
  scale_x_continuous(limits = c(-8, 8), breaks = seq(-8, 8, by = 4)) +  
  scale_y_continuous(limits = c(0, 30), breaks = seq(0, 30, by = 5)) +
  guides(col = guide_colorbar(title = "-log10_p_value"),
         size = "none")
ADD REPLY
1
Entering edit mode

I both hate that this question doesn't have any text asking or explaining their data or anything specific but also that without text I know exactly what they want to know.

This can happen for a variety of reasons. before we jump and assume whatever you are comparing is have such a biological impact that all genes are higher expresses (which would have impacts on how to interpret results as some DE approaches have the assumption most genes are not DE) , the most common source of this error is normalization was off at a previous step in some capacity. edgeR has a pretty good library normalization functions built in. another normalization possibility is you gave a function of a package like DESeq2 TPMs or something it wasnt expecting when it was expected RAW counts, and then get something wonky like this...

ADD REPLY
0
Entering edit mode

Thanks for your answer! I did use DEseq2 to calculate the DE genes in a pseudobulk object abstracted from a Seurat object. Should I change the R package to edgeR or something else ?

ADD REPLY
0
Entering edit mode

while I am biased to bioconductor packages, Seurat does have Mike Love's DEseq2 as method pre-built into the FindMarkers() function.

but vanilla deseq2 , as the vignette says, expects raw counts. so this might be driving the issue.

you could def do edgeR and limma , or you could change your input into DEseq2 to raw counts. I havent seen your code yet but if that was the problem , that might be a good fix.

ADD REPLY
0
Entering edit mode
ATpoint ★ 4.5k
@atpoint-13662
Last seen 10 hours ago
Germany

Seurat is not a Bioconductor package, so debugging what the function does internally with pseudobulks as input is off-topic here. Generally, this indicates a normalization issue since the plot is notably offset along the x-axis to the right.

My advise, if you want to proceed with Bioconductor packages alone, is to pull the matrix of pseudobulk counts from that Seurat object and run it through DESeq2 manually as described in the vignette.

ADD COMMENT
0
Entering edit mode
Shuning • 0
@3f35ee9d
Last seen 8 months ago
United States

Hi, I recently met this weird problem. One method is to perform DESeq2 directly on pseudobulk data. You can refer to https://hbctraining.github.io/scRNA-seq_online/lessons/pseudobulk_DESeq2_scrnaseq.html. Hope it helps you.

ADD COMMENT

Login before adding your answer.

Traffic: 639 users visited in the last hour
Help About
FAQ
Access RSS
API
Stats

Use of this site constitutes acceptance of our User Agreement and Privacy Policy.

Powered by the version 2.3.6