Hello All!
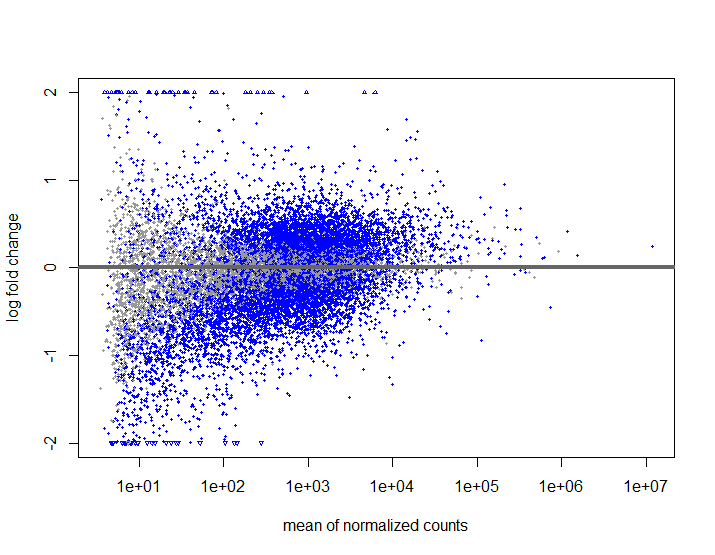
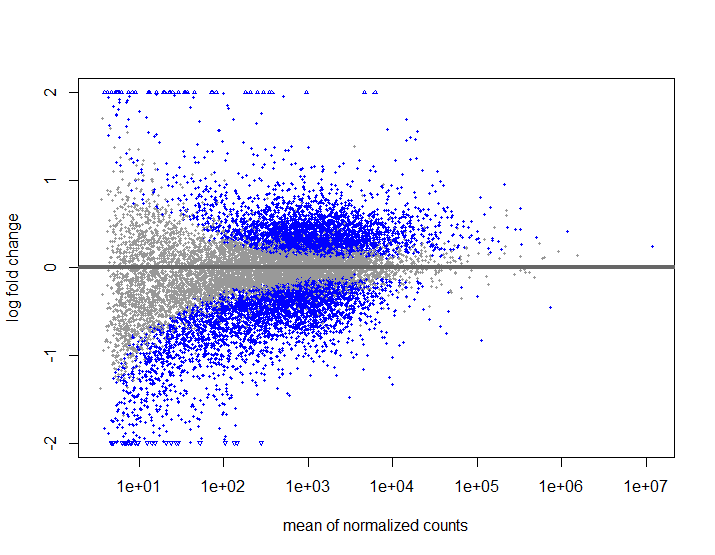
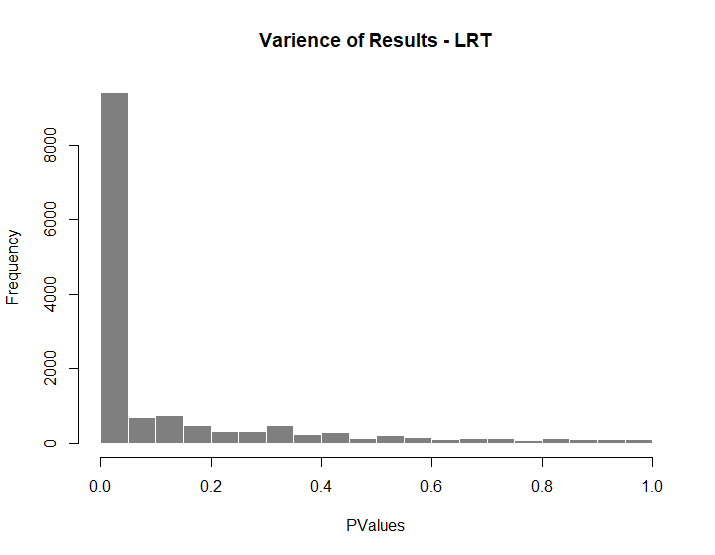
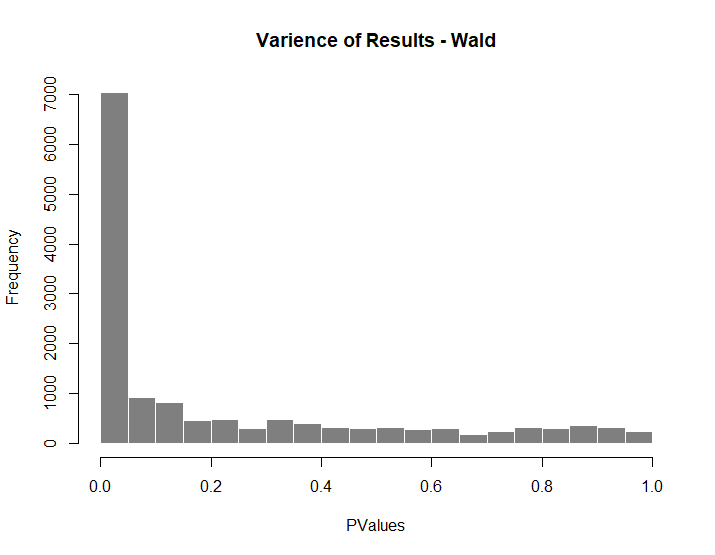
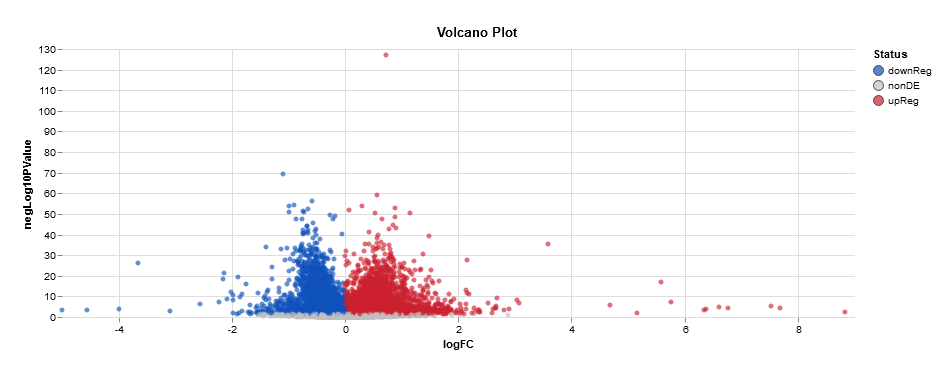
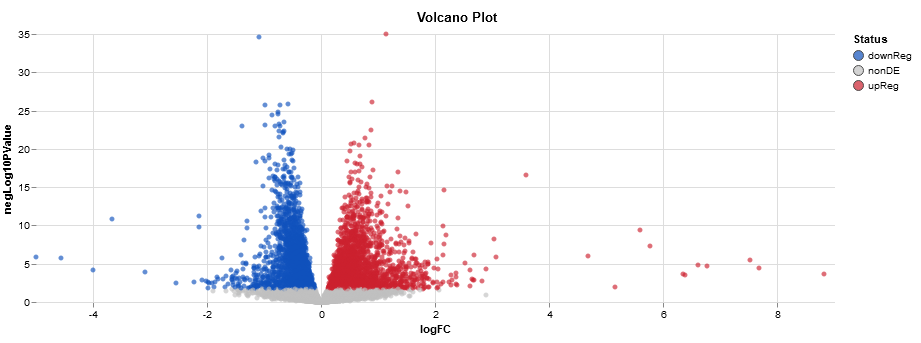
I am running DESeq2 on my RNA Seq dataset. I have four groups in my treatment with 8 replicates and about 14,500 rows (genes) after using keep (removing low copy numbers) and removing NA. I also used level so that my Control is the reference. So I have my Control (c), Treatment 1 (T1), Treatment 2 (T2), and Treatment (T3). I want to compare DE in T1 vs T2, T2 vs T3, T2 vs T1, and T1 vs T3. I was thinking of going with LRT, because I read that you would use that if you have more than 3 or 2 in your group. After normalizing I decided to do results and use contrast to compare T2 vs T3. My results look weird and it is making question whether I should do LRT or Wald test for normalization. Below are my MA plots for LRT and Wald, my histogram to look at frequency, and volcano plots to look at up and down regulated genes. Any input is greatly appreciated as this is my first time doing RNA Seq and I am the only bioinformatician in my group so I have no one to turn to, to ask questions.
Question I need answered: Is LRT correct or should I go Wald with lfcshrink? or should I do LRT with lfcshrink?
Links I have read (there are more):
Bioconductor vignettes Documentation
NCBI Power analysis for RNA-Seq differential expression studies
Below is snippets of my code:
ddsLRT <- DESeq(dds, test = "LRT", fitType = "parametric", reduced = ~1)
ddsWald <- DESeq(dds, test = "Wald", fitType = "parametric")

T2VT3Res <- results(ddsLRT, contrast = c("treatment","T2","T3")) #Tried to put alpha = 0.05, but the graph looked the same.
T2VT3ResW <- results(ddsWald, contrast = c("treatment","T2","T3"))

plotMA(T2VT3Res , ylim=c(-2,2))
plotMA(T2VT3ResW , ylim=c(-2,2))

hist(T2VT3Res $pvalue[T2VT3Res $baseMean], breaks = 0:20/20,col = "grey50", border = "white", main = "Varience of Results - LRT", xlab = "PValues")
hist(T2VT3ResW $pvalue[T2VT3ResW $baseMean], breaks = 0:20/20,col = "grey50", border = "white", main = "Varience of Results - Wald", xlab = "PValues")


Does one of those tutorials show that you use contrasts with LRT? I didn't think it worked that way; LRT just tells you if things are different among all your groups, I don't think it captures the patterns of how this group or that group behaves for specific genes.
I used contrast in the results function not in LRT. I used it so I could do pairwise comparison.