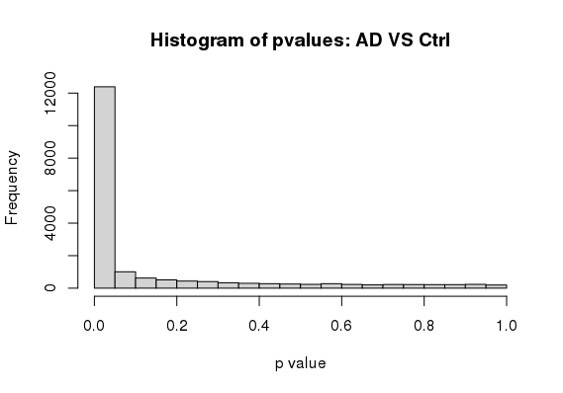
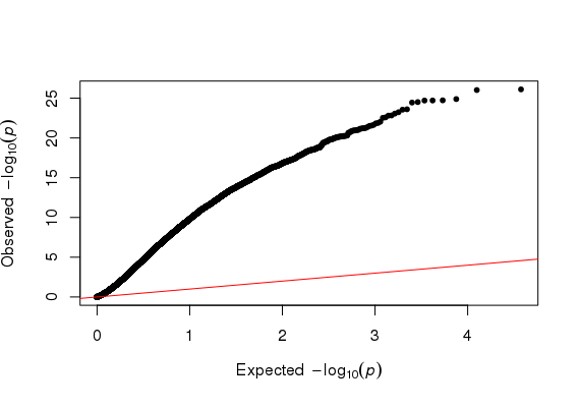
Hi Michael, I am using DESeq2 to analyze my RNA seq dataset, but I am a bit confused about the conflicting result between DESeq2 and Quantile Quantile plot. As far as I know, Deseq2 already enables me to choose 'BH/fdr etc' to correct for false positives from multiple comparison tests, but if I further take the p values or p-adj values generated by Deseq2, to draw a QQ plot (as follows), it just indicates that I have too many false positives and the model is inflated.
So I just wonder is it necessary or reasonable to use a QQ plot to decide whether I have too many false positives of a RNA seq analysis, and further use another package such as 'fdrtool' to further correct for false positives, and replace the original p-adj values of Deseq2 with the regenerated fdr values? Because on one hand Deseq2 already has multiple test correction, on the other hand a QQ plot is used in GWAS study as far as I know.
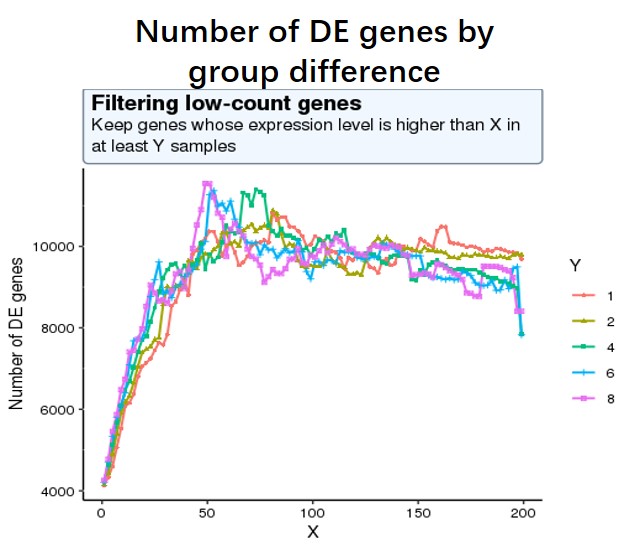
And my second question is as low-expressed genes can negatively affect the result of multiple test correction (more unuseful genes lead to more false positives), so I decide to use a criterion where the number of sig DE genes reaches the peak (maximum) of the following curve, or keep genes which express at least 50 reads in at least 8 samples (18828 genes after filtering). I am not sure whether this strategy is reasonable?
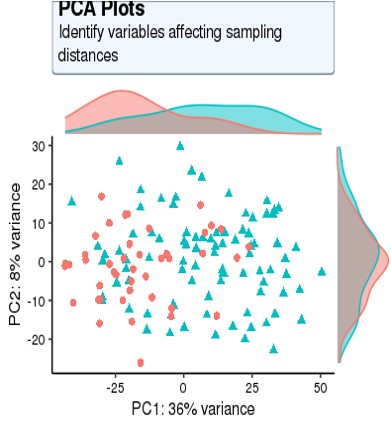
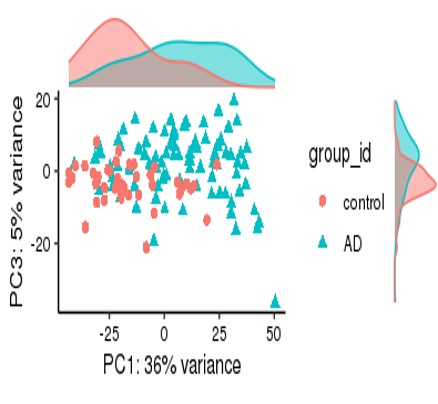
For my dataset, I have 134 samples, with the design model of 'Area + Sex + Sequencing_batch + Age + Group', where variable 'Age' is continuous and all other variables are binary categorical variables. The following PCA result uses VST data and DE compares between case and control group. Thanks for you comment!
Code as shown below
dds <- DESeqDataSetFromMatrix(data_final,
                              colData = metadata_final,
                              design= ~ group_id)
dds$group_id<-relevel(dds$group_id,ref = 'control')
design(dds)<- ~ Area+Sex+Sequencing_batch+Age+Group
dds <- DESeq(dds)
normalized_counts <- counts(dds,
                            normalized = TRUE)
vsd <- vst(object=dds,blind=FALSE)
pcaData <- plotPCA(vsd,
                                   ntop = 5000,
                                   intgroup=c("Group", "Area",'Sex','Sequencing_batch'),
                                   returnData=TRUE)
contrast_fmt = c("group_id", "AD", "control")
res <- results(dds,
               contrast = contrast_fmt,
               pAdjustMethod = "fdr",
               alpha = 0.05,
               lfcThreshold=0)
# log fold change shrinkage ignored here
hist(res$padj[res$baseMean > 1], breaks = 0:20/20,
     col = "grey50", border = "white")
library(qqman)
qq(res$padj)

#code for number of sig DE genes by changing different filtering threshold not shown, threshold is #like this pattern, for each iteration, run Deseq2 and detect the number of sig DE genes with p-adj < #0.05
idx <- rowSums((df)>=X) >= Y
data_final <- df[idx,]


(glmGamPoi can be obtained with a version of DESeq2 since 1.30, now we are on 1.36)
Yeah my current project is on R 4.0.2 and seems the highest version of Deseq2 I get is just 1.28.1; Maybe in future I'll immigrant my project and all related packages onto higher R version :)
Hi Michael, Thank you for kind reply, as my current Deseq2 version is not that high, so I just choose fitType = 'parametric', and I get the following result, quite similar to what I got from Wald test, so is it still needed to use a QQ plot to detect and correct for the false positives? Thanks!
#
out of 18819 with nonzero total read count adjusted p-value < 0.05 LFC > 0 (up) : 6045, 32% LFC < 0 (down) : 5720, 30% outliers [1] : 0, 0% low counts [2] : 0, 0% (mean count < 8)
You can't say these are false positives from your current data. That would presume that the vast majority of the genes are null, that the LFC is truly 0 for most genes.
While this is appropriate for some studies, I don't think it is for a generic RNA-seq study.
From the PCA plot there are systematic differences between these groups, it in fact dominates PC1. So the null is clearly false across the genes that contribute to the most dominant axis of variance (unsupervised) in your data.
If you care about large effects, use the following:
Thanks for your comment, it really helps a lot!
Could you please tell me why do you think Q-Q plot is inappropriate for a generic RNA-seq study in detail?
I would really appreciate that if you could answer my question.
Best regards,
Yujin Kim.
We discuss in the original paper, there are many studies where the majority of genes are affected in some amount by treatment. QQ-plot as I use it is helpful when the signal is sparse and the data consist with the null is dominant, as you expect the points to mostly fall on the theoretical line under the null. So if you have a dataset which is of the former type, I'm not sure what you learn from the QQ-plot.
Thanks for your reply :)