Hello DESeq2 community,
I'm working on a complex RNA-seq experiment with a large design, involving 5 different timepoints, 2 different stimulation conditions, and 2 disease states, resulting in a total of 96 samples. In my initial preprocessing steps, I've filtered out genes with low expression (<100 counts).
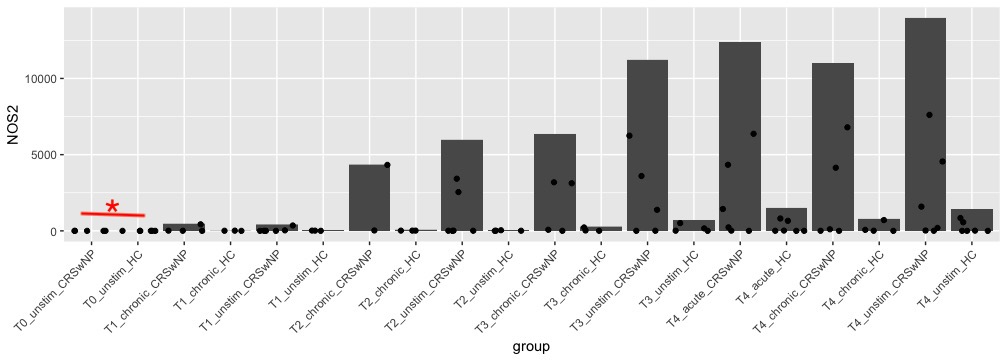
However, as I delve into differential expression analysis, I've encountered a situation where I'm observing many differentially expressed genes (DEGs) with adjusted p-values (padj) < 0.1 in certain comparisons. What's intriguing is that most of these genes have zero transcript counts in the majority of samples within those specific comparison groups. These genes were not filtered out initially because they exhibit expression in other groups.
For example (plot below), Deseq2 DE show significance in first two groups, even there was only 1 sample with few transcripts.
Now my question is how to get rid of these DEGs? As these are not really DEGs.


Is there a question?
My question is how to avoid these DEGs? There are so many DEGs that are not actually expressed at T0. Is there any filter ? my current code is `dds <- DESeqDataSetFromMatrix(countData = cts, colData = coldata, design = ~ Disease + Treatment + Timepoint)
dds <- dds[ rowSums(counts(dds)) > 100, ] dds <- DESeq(dds) dds$group <- factor(paste0(dds$Treatment, dds$Timepoint, dds$Disease)) design(dds) <- ~ group dds <- DESeq(dds)
resultsNames(dds)
res<- results(dds, contrast = c("group","unstimT0CRSwNP", "unstimT0HC"), independentFiltering=TRUE)
`