
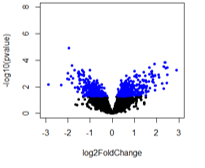
I ran DESeq2 (using default settings) comparing different groups (A vs B, with B having 1, 2, 3 subgroups). For the volcano plots below, red = adjusted pvalue < 0.1 and blue = pvalue < 0.05.
For the first comparison (A vs B1), there are no adjusted pvalue significant genes (expected).
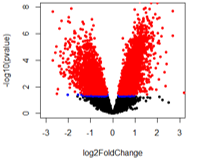
For the second comparison (A vs B2), there are a huge number of adjusted pvalue genes.
For the last comparison (A vs B3), it looks like there are pvalue significant genes that should also be adjusted pvalue significant but that doesn't seem to be the case.
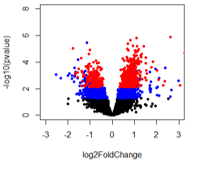
When comparing A vs B2 and A vs B3, it appears that genes are adjusted pvalue significant at lower pvalues than B2 compared to B3. I've looked at this with other adjusted p-value methods and get the same trend. Any ideas and what could be happened with A vs B2 to get what looks like pvalue inflation?
This is the code used to generate the volcano plots
#reset par
par(mfrow=c(1,1))
options(repr.plot.width=6, repr.plot.height=6)

# Make a basic volcano plot
with(res, plot(log2FoldChange, -log10(pvalue), pch=20, xlim=c(-3,3), ylim=c(0,8),
                xlab="log2FoldChange", ylab="-log10(p-value)", cex.axis = 1, cex.lab = 1))
with(subset(res, pvalue<.05), points(log2FoldChange, -log10(pvalue), pch=20, col="blue"))
with(subset(res, padj<.1), points(log2FoldChange, -log10(pvalue), pch=20, col="red"))

The intensity of p-value adjustment, for most correction methods, trends with the number of comparisons being made. Do you happen to know the number of comparisons (tests) being performed for A vs B3 compared to A vs B2?
The number of comparisons appears to be the same for all (14,375), which I am basing of the DESeq2 summary "out of 14375 with nonzero total read count".
The number of pvalue < 0.05 genes is: A vs B1: 809; A vs B2: 5571; A vs B3: 2739
And the number of adjusted pvalue < 0.1 genes is: A vs B1: 0; A vs B2: 5077, A vs B3: 824
So out of the pvalue < 0.05 genes for A vs B2, 91% are also adjusted p-value significant. Seems off to me!