Entering edit mode

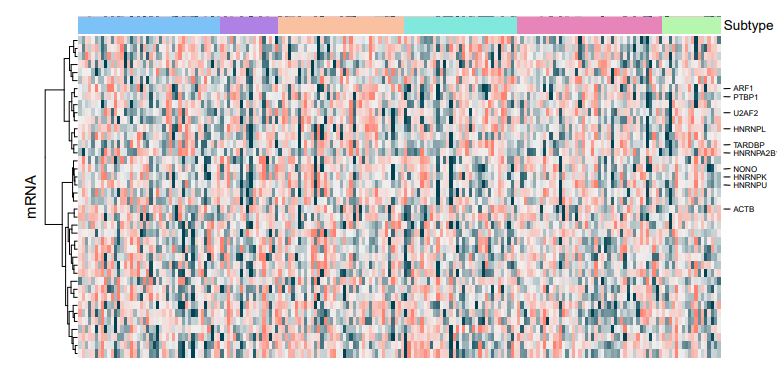
I want to perform pairwise comparisons between the different groups and retrieve only the top/bottom 5 for each comparison. The output (heatmap) did not show any visible demarcation between the groups. Is there something wrong with my code? The input is raw RNA-seq count.
group <- factor(clin.info$subtype, levels=c("1a", "1b", "1c", "2a",
"2b", "2c")) design <- model.matrix(~group) rownames(design) <-
rownames(clin.info) colnames(design) <- c("KIRP1a", "KIRP1b",
"KIRP1c", "KIRP2a", "KIRP2b", "KIRP2c")

mrna.dge <- DGEList(counts=mat, group=group, remove.zeros=T) keep <-
filterByExpr(mrna.dge, design, min.count=50) mrna.dge <-
mrna.dge[keep,,keep.lib.sizes=FALSE] mrna.dge <-
calcNormFactors(mrna.dge)

v <- voom(mrna.dge, design, plot=TRUE) fit <- lmFit(v, design)
contrasts.matrix <- makeContrasts("KIRP1a-KIRP1b", "KIRP1a-KIRP1c","KIRP1a-KIRP2a", "KIRP1a-KIRP2b", "KIRP1a-KIRP2c","KIRP1b-KIRP1c","KIRP1b-KIRP2a", "KIRP1b-KIRP2b", "KIRP1b-KIRP2c","KIRP1c-KIRP2a","KIRP1c-KIRP2b", "KIRP1c-KIRP2c","KIRP2a-KIRP2b","KIRP2a-KIRP2c","KIRP2b-KIRP2c",levels=colnames(design))
fit2 <- contrasts.fit(fit, contrasts.matrix) efit <- eBayes(fit2)
Pairwise comparison:
KIRP1a.v.KIRP1b.DEG <- topTable(efit, coef=1, adjust.method="BH", sort.by="p", p.value=0.05)
KIRP1a.v.KIRP1c.DEG <- topTable(efit, coef=2, adjust.method="BH", sort.by="p", p.value=0.05)
KIRP1a.v.KIRP2a.DEG <- topTable(efit, coef=3, adjust.method="BH", sort.by="p", p.value=0.05)
KIRP1a.v.KIRP2b.DEG <- topTable(efit, coef=4, adjust.method="BH", sort.by="p", p.value=0.05)
KIRP1a.v.KIRP2c.DEG <- topTable(efit, coef=5, adjust.method="BH", sort.by="p", p.value=0.05)
KIRP1b.v.KIRP1c.DEG <- topTable(efit, coef=6, adjust.method="BH", sort.by="p", p.value=0.05)
KIRP1b.v.KIRP2a.DEG <- topTable(efit, coef=7, adjust.method="BH", sort.by="p", p.value=0.05)
KIRP1b.v.KIRP2b.DEG <- topTable(efit, coef=8, adjust.method="BH", sort.by="p", p.value=0.05)
KIRP1b.v.KIRP2c.DEG <- topTable(efit, coef=9, adjust.method="BH", sort.by="p", p.value=0.05)
KIRP1c.v.KIRP2a.DEG <- topTable(efit, coef=10, adjust.method="BH", sort.by="p", p.value=0.05)
KIRP1c.v.KIRP2b.DEG <- topTable(efit, coef=11, adjust.method="BH", sort.by="p", p.value=0.05)
KIRP1c.v.KIRP2c.DEG <- topTable(efit, coef=12, adjust.method="BH", sort.by="p", p.value=0.05)
KIRP2a.v.KIRP2b.DEG <- topTable(efit, coef=13, adjust.method="BH", sort.by="p", p.value=0.05)
KIRP2a.v.KIRP2c.DEG <- topTable(efit, coef=14, adjust.method="BH", sort.by="p", p.value=0.05)
KIRP2b.v.KIRP2c.DEG <- topTable(efit, coef=15, adjust.method="BH", sort.by="p", p.value=0.05)
Combine and reorder DEGs:
top.ranked.mrna <- rbind(KIRP1a.v.KIRP1b.DEG, KIRP1a.v.KIRP1c.DEG, KIRP1a.v.KIRP2a.DEG, KIRP1a.v.KIRP2b.DEG, KIRP1a.v.KIRP2c.DEG,KIRP1b.v.KIRP1c.DEG, KIRP1b.v.KIRP2a.DEG, KIRP1b.v.KIRP2b.DEG, KIRP1b.v.KIRP2c.DEG,KIRP1c.v.KIRP2a.DEG, KIRP1c.v.KIRP2b.DEG, KIRP1c.v.KIRP2c.DEG, KIRP2a.v.KIRP2b.DEG, KIRP2a.v.KIRP2c.DEG)
top.ranked.mrna.ordered <- top.ranked.mrna[order(top.ranked.mrna$adj.P.Val),]
Up- and down-regulated genes:
# Upregulated DEGs
deg.up <- top.ranked.mrna[top.ranked.mrna$adj.P.Val < 0.05 & top.ranked.mrna$logFC > 0, ]
deg.up <- deg.up[rownames(deg.up) %in% rownames(mat),]
deg.up <- deg.up[order(deg.up$adj.P.Val),]
deg.up.top <- deg.up[1:10,]

# Downregulated DEGs
deg.down <- top.ranked.mrna[top.ranked.mrna$adj.P.Val < 0.05 & top.ranked.mrna$logFC < 0, ]
deg.down <- deg.down[rownames(deg.down) %in% rownames(mat),]
deg.down <- deg.down[order(deg.down$adj.P.Val),]
deg.down.top <- deg.down[1:10,]

# All DEGs
all.deg <- rbind(deg.up, deg.down)
all.deg <- mat[rownames(mat) %in% rownames(all.deg),]
all.deg <- cpm(all.deg, log = TRUE)[rownames(all.deg) %in% rownames(top.ranked.mrna.ordered),]
all.deg <- all.deg[order(match(rownames(all.deg),rownames(top.ranked.mrna.ordered))),]

# Subset of DEGs for heatmap (top and bottom 5 of each group)

top.ranked.subset.hyper <- rbind(KIRP1a.v.KIRP1b.DEG[1:5,], KIRP1a.v.KIRP1c.DEG[1:5,], KIRP1a.v.KIRP2a.DEG[1:5,], KIRP1a.v.KIRP2b.DEG[1:5,], KIRP1a.v.KIRP2c.DEG[1:5,],KIRP1b.v.KIRP1c.DEG[1:5,], KIRP1b.v.KIRP2a.DEG[1:5,], KIRP1b.v.KIRP2b.DEG[1:5,], KIRP1b.v.KIRP2c.DEG[1:5,],KIRP1c.v.KIRP2a.DEG[1:5,], KIRP1c.v.KIRP2b.DEG[1:5,], KIRP1c.v.KIRP2c.DEG[1:5,], KIRP2a.v.KIRP2b.DEG[1:5,], KIRP2a.v.KIRP2c.DEG[1:5,])
top.ranked.subset.hyper <-  top.ranked.subset.hyper[order(top.ranked.subset.hyper$adj.P.Val),]


top.ranked.subset.hypo <- rbind(bottom_n(KIRP1a.v.KIRP1b.DEG,5), bottom_n(KIRP1a.v.KIRP1c.DEG,5), bottom_n(KIRP1a.v.KIRP2a.DEG,5), bottom_n(KIRP1a.v.KIRP2b.DEG,5),bottom_n(KIRP1a.v.KIRP2c.DEG,5),bottom_n(KIRP1b.v.KIRP1c.DEG,5), bottom_n(KIRP1b.v.KIRP2a.DEG,5), bottom_n(KIRP1b.v.KIRP2b.DEG,5), bottom_n(KIRP1b.v.KIRP2c.DEG,5),bottom_n(KIRP1c.v.KIRP2a.DEG,5), bottom_n(KIRP1c.v.KIRP2b.DEG,5), bottom_n(KIRP1c.v.KIRP2c.DEG,5), bottom_n(KIRP2a.v.KIRP2b.DEG,5), bottom_n(KIRP2a.v.KIRP2c.DEG,5))
top.ranked.subset.hyper <-  top.ranked.subset.hyper[order(top.ranked.subset.hyper$adj.P.Val),]

top.deg <- rbind(top.ranked.subset.hyper, top.ranked.subset.hypo)
top.deg <- all.deg[rownames(all.deg) %in% rownames(top.deg),]

# Remove duplicate rows
top.deg <- top.deg[!duplicated(top.deg), ]

# Normalize for plotting
norm.deg <- zscore(top.deg, dist="chisq")
Input:
dput(mat[1:20,1:20])
structure(c(2583, 1360, 1722, 2590, 4478, 1564, 463, 2347, 2467,
7020.91, 3227, 4716, 5240, 2279.04, 2240, 2618, 13148, 2202,
6013, 1524, 4720, 2013, 2615, 2562, 4518, 1300, 636, 2504, 1937,
2328.95, 5165, 6354, 4381, 957.21, 3274, 1999, 1467, 10893, 1729,
1184, 2768, 2388, 3338, 2715, 5936, 2405, 1010, 4546, 3300, 1941,
7047, 7309, 58, 1509.53, 5776, 2627, 26281, 4210, 2979, 772,
1689, 1366, 1407, 3010, 4139, 672, 333, 1772, 872, 2005, 1704,
4440, 1690, 914.06, 1779, 1266, 4715, 1801, 1760, 1228, 3618,
1928, 2144, 3096, 4825, 1257, 1701, 2586, 4340, 2491.91, 2022,
3102, 4289, 875.24, 2096, 1918, 1443, 2344, 2843, 4531, 2936,
1338, 1957, 1180, 5419, 785, 1685, 2939, 1220, 1251.95, 8810,
4346, 4017, 2240.73, 3202, 1269, 5575, 3407, 1276, 306, 2889,
2877, 4046, 10246, 10136, 3848.9, 1638, 3368, 4955, 6752.8, 2340,
2882, 8117, 11895.08, 3060, 8352, 42026, 5959, 2547, 11283, 3441,
1990, 2177, 3708, 4412, 2445, 1296, 2567, 7109, 2101.96, 3357,
3033, 23338, 773.54, 2634, 1730, 4076, 12475, 440, 3734, 2354,
1971, 1954, 3901, 7452, 1621, 1663, 6607, 7042, 2396.97, 2750,
8182, 32687, 1392.2, 1825, 5934, 5520, 4346, 4304, 3562, 9455,
3503, 2853, 3180, 7491, 2593, 1132, 3667, 1569, 1982.91, 9183,
11425, 101, 2704.9, 2063, 4284, 83201, 3977, 1541, 41, 1495,
2128, 2410, 2823, 4972, 1885, 498, 2198, 1382, 2375.96, 2041,
2392, 671, 2106.5, 2228, 3549, 1022, 3825, 1466, 530, 1776, 539,
1314, 1323, 1405, 324, 617, 1799, 267, 607, 508, 3166, 1316,
609, 1334, 977, 543, 1114, 698, 211, 5089, 1167, 1984, 2649,
4904, 1999, 1415, 3950, 1005, 2335, 4258, 2551, 5704, 1262.89,
2473, 1704, 13564, 5657, 1941, 1031, 409, 1626, 2055, 1867, 9169,
2193, 1051, 5418, 10556, 1471.95, 1919, 2634, 2855, 2077.01,
3088, 2278, 29390, 5413, 906, 4104, 1908, 1086, 1769, 2562, 5130,
1483, 340, 2856, 1447, 5589.95, 2492, 3121, 2546, 1867.33, 1807,
4363, 6303, 1725, 3403, 115, 1980, 3042, 2040, 6031, 8613, 2544,
2492, 3244, 14574, 5972.64, 4345, 6637, 15937, 6983.94, 3255,
1764, 20080, 3549, 948, 4593, 3357, 899, 1182, 2393, 3589, 1003,
3797, 2896, 7163, 1927.93, 2049, 2486, 12389, 1235.82, 2010,
2006, 1026, 2592, 2966, 5589, 3749, 2139, 2756, 5537, 5421, 2216,
1638, 3535, 4765, 2116, 2186, 7265, 4608, 3230.19, 4147, 4101,
5052, 6825, 1134, 2077, 1198, 1942, 3534, 4988, 6122, 4154, 3954,
3603, 47622, 6097.76, 7273, 11667, 33619, 3647.39, 4561, 4815,
23369, 12155, 1497, 3239, 4801, 1821, 1992, 5675, 6114, 2866,
631, 2112, 1125, 7291.51, 7144, 13832, 12439, 730.17, 2610, 6179,
9147, 13289, 2301, 7482), dim = c(20L, 20L), dimnames = list(
    c("A4GALT", "AACS", "AAGAB", "AAK1", "AAMP", "AASDHPPT",
    "AASS", "AATF", "ABAT", "ABCA1", "ABCA2", "ABCA3", "ABCB1",
    "ABCB6", "ABCB8", "ABCC1", "ABCC3", "ABCC4", "ABCC5", "ABCC6"
    ), c("TCGA.2K.A9WE.01", "TCGA.2Z.A9J1.01", "TCGA.2Z.A9J3.01",
    "TCGA.2Z.A9J5.01", "TCGA.2Z.A9J6.01", "TCGA.2Z.A9J7.01",
    "TCGA.2Z.A9J8.01", "TCGA.2Z.A9JD.01", "TCGA.2Z.A9JI.01",
    "TCGA.2Z.A9JJ.01", "TCGA.2Z.A9JO.01", "TCGA.2Z.A9JQ.01",
    "TCGA.4A.A93W.01", "TCGA.4A.A93X.01", "TCGA.4A.A93Y.01",
    "TCGA.5P.A9JU.01", "TCGA.5P.A9JY.01", "TCGA.5P.A9KE.01",
    "TCGA.A4.7288.01", "TCGA.A4.7583.01")))

dput(clin.info[,c("survival", "subtype")][1:20,])
structure(list(survival = c("lts", "lts", "lts", "lts", "lts",
"lts", "lts", "lts", "lts", "lts", "lts", "lts", "lts", "lts",
"lts", "non-lts", "lts", "lts", "lts", "lts"), subtype = c("2a",
"1a", "1b", "1a", "1a", "1b", "2b", "2b", "2a", "1a", "2b", "1b",
"1c", "2b", "2a", "2b", "1b", "2b", "2b", "1c")), row.names = c("TCGA.Y8.A8S1.01",
"TCGA.Y8.A8S0.01", "TCGA.Y8.A8RZ.01", "TCGA.Y8.A8RY.01", "TCGA.Y8.A897.01",
"TCGA.Y8.A896.01", "TCGA.Y8.A895.01", "TCGA.Y8.A894.01", "TCGA.WN.A9G9.01",
"TCGA.V9.A7HT.01", "TCGA.UZ.A9Q1.01", "TCGA.UZ.A9Q0.01", "TCGA.UZ.A9PZ.01",
"TCGA.UZ.A9PX.01", "TCGA.UZ.A9PV.01", "TCGA.UZ.A9PU.01", "TCGA.UZ.A9PS.01",
"TCGA.UZ.A9PR.01", "TCGA.UZ.A9PP.01", "TCGA.UZ.A9PO.01"), class = "data.frame")
Plot:

Hello James, Thank you for your comments. How do I obtain the top 5 up- or down-regulated DEGs for each contrast?
Would this make sense?