Entering edit mode

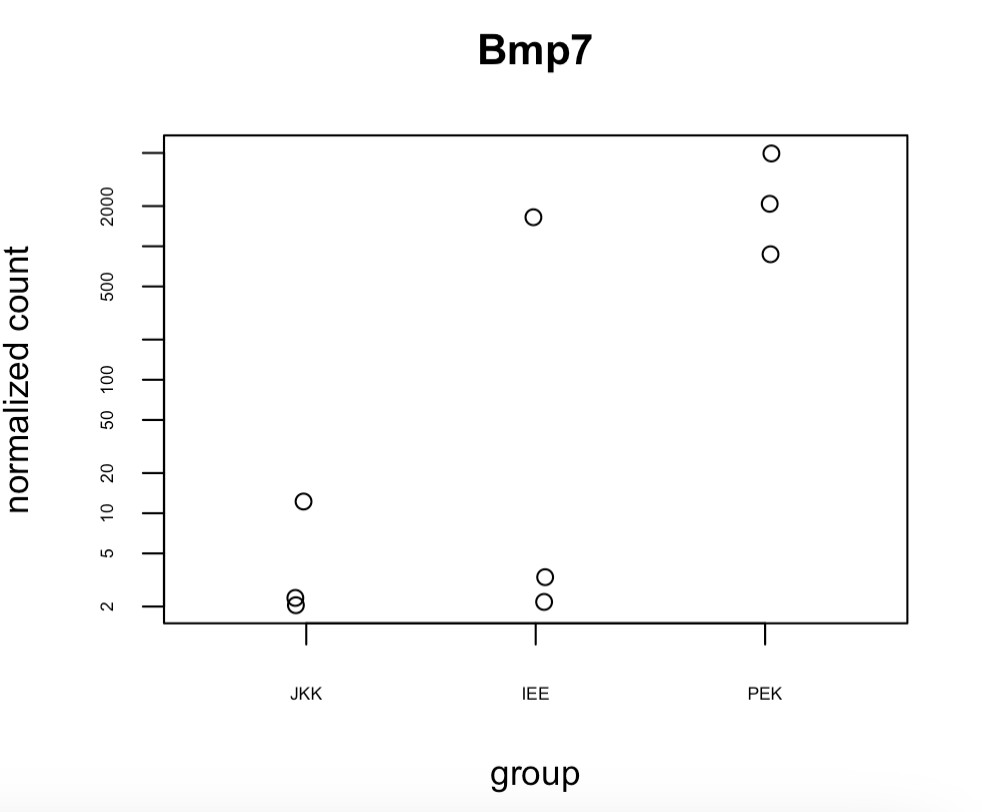
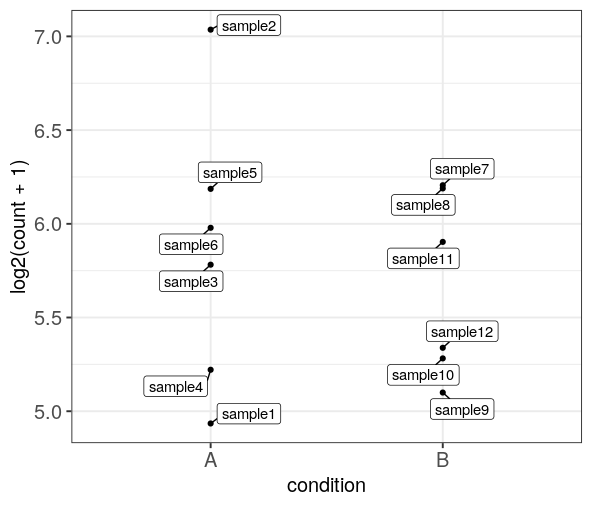
I'm using plotCounts(ddsM14.5, gene = "Bmp7", intgroup=c("Region")) to find expression of Bmp7 in each sample. I have 3 repeats for each region and I want to identify which sample the outlier is from. Can I colour or label the point by the colname?