
I am looking at differential genes between disease cases and controls (35 sample in total). I ran DESEQ2 with the raw counts of protein coding genes from my total RNA sequencing experiment to identify my DEGs.
I understand that when doing PCA, its better to transform the normalized data to the log2 scale, either rlog and vst.
Doing this, I get two slightly different PCAs
rld <- rlogTransformation(dds, blind=FALSE)
plotPCA(rld, intgroup="status")
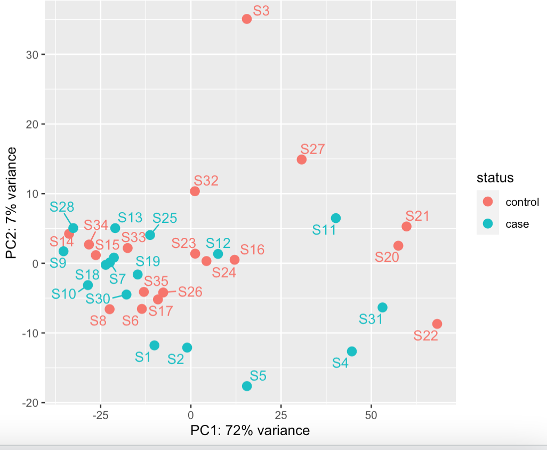
vsd <- vst(dds, blind=FALSE)
pcaData <- plotPCA(vsd, intgroup=c("status"), returnData=TRUE)
percentVar <- round(100 * attr(pcaData, "percentVar"))
ggplot(pcaData, aes(PC1, PC2, color=status)) +
geom_point(size=3) +
xlab(paste0("PC1: ",percentVar[1],"% variance")) +
ylab(paste0("PC2: ",percentVar[2],"% variance")) +
geom_text_repel(aes(label=ss$sample), show.legend = FALSE)
coord_fixed()
No clear outlier of S3 (or other samples) using this method (VST)
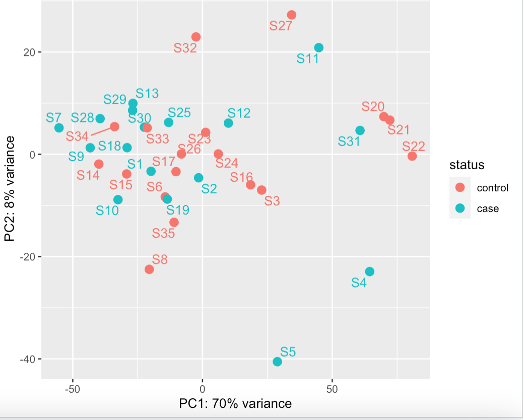
rld <- rlogTransformation(dds, blind=FALSE)

pcaData <- plotPCA(rld, intgroup=c("status"), returnData=TRUE)
percentVar <- round(100 * attr(pcaData, "percentVar"))
ggplot(pcaData, aes(PC1, PC2, color=status)) +
  geom_point(size=3) +
  xlab(paste0("PC1: ",percentVar[1],"% variance")) +
  ylab(paste0("PC2: ",percentVar[2],"% variance")) +
  # geom_text_repel(aes(label=ss$sample), show.legend = FALSE)
  coord_fixed()
This still shows potentially S3 might be an outlier (rlog)
My question is which transformation to use (vst or rlog)?
Generally, the literature and bioconductor suggests going for vst when you are looking for outlier identification. However, DESeq2 also suggests going for rlog rather than when you have small number of samples (>30) and vST for large datasets (hundreds of samples). I have 35.
These decisions will ultimately affect whether I exclude S3 or not, which will affect downstream data analysis for e.g. the number of DEGs. (If I exclude S3, I get 9 DEGS, rather than 21)
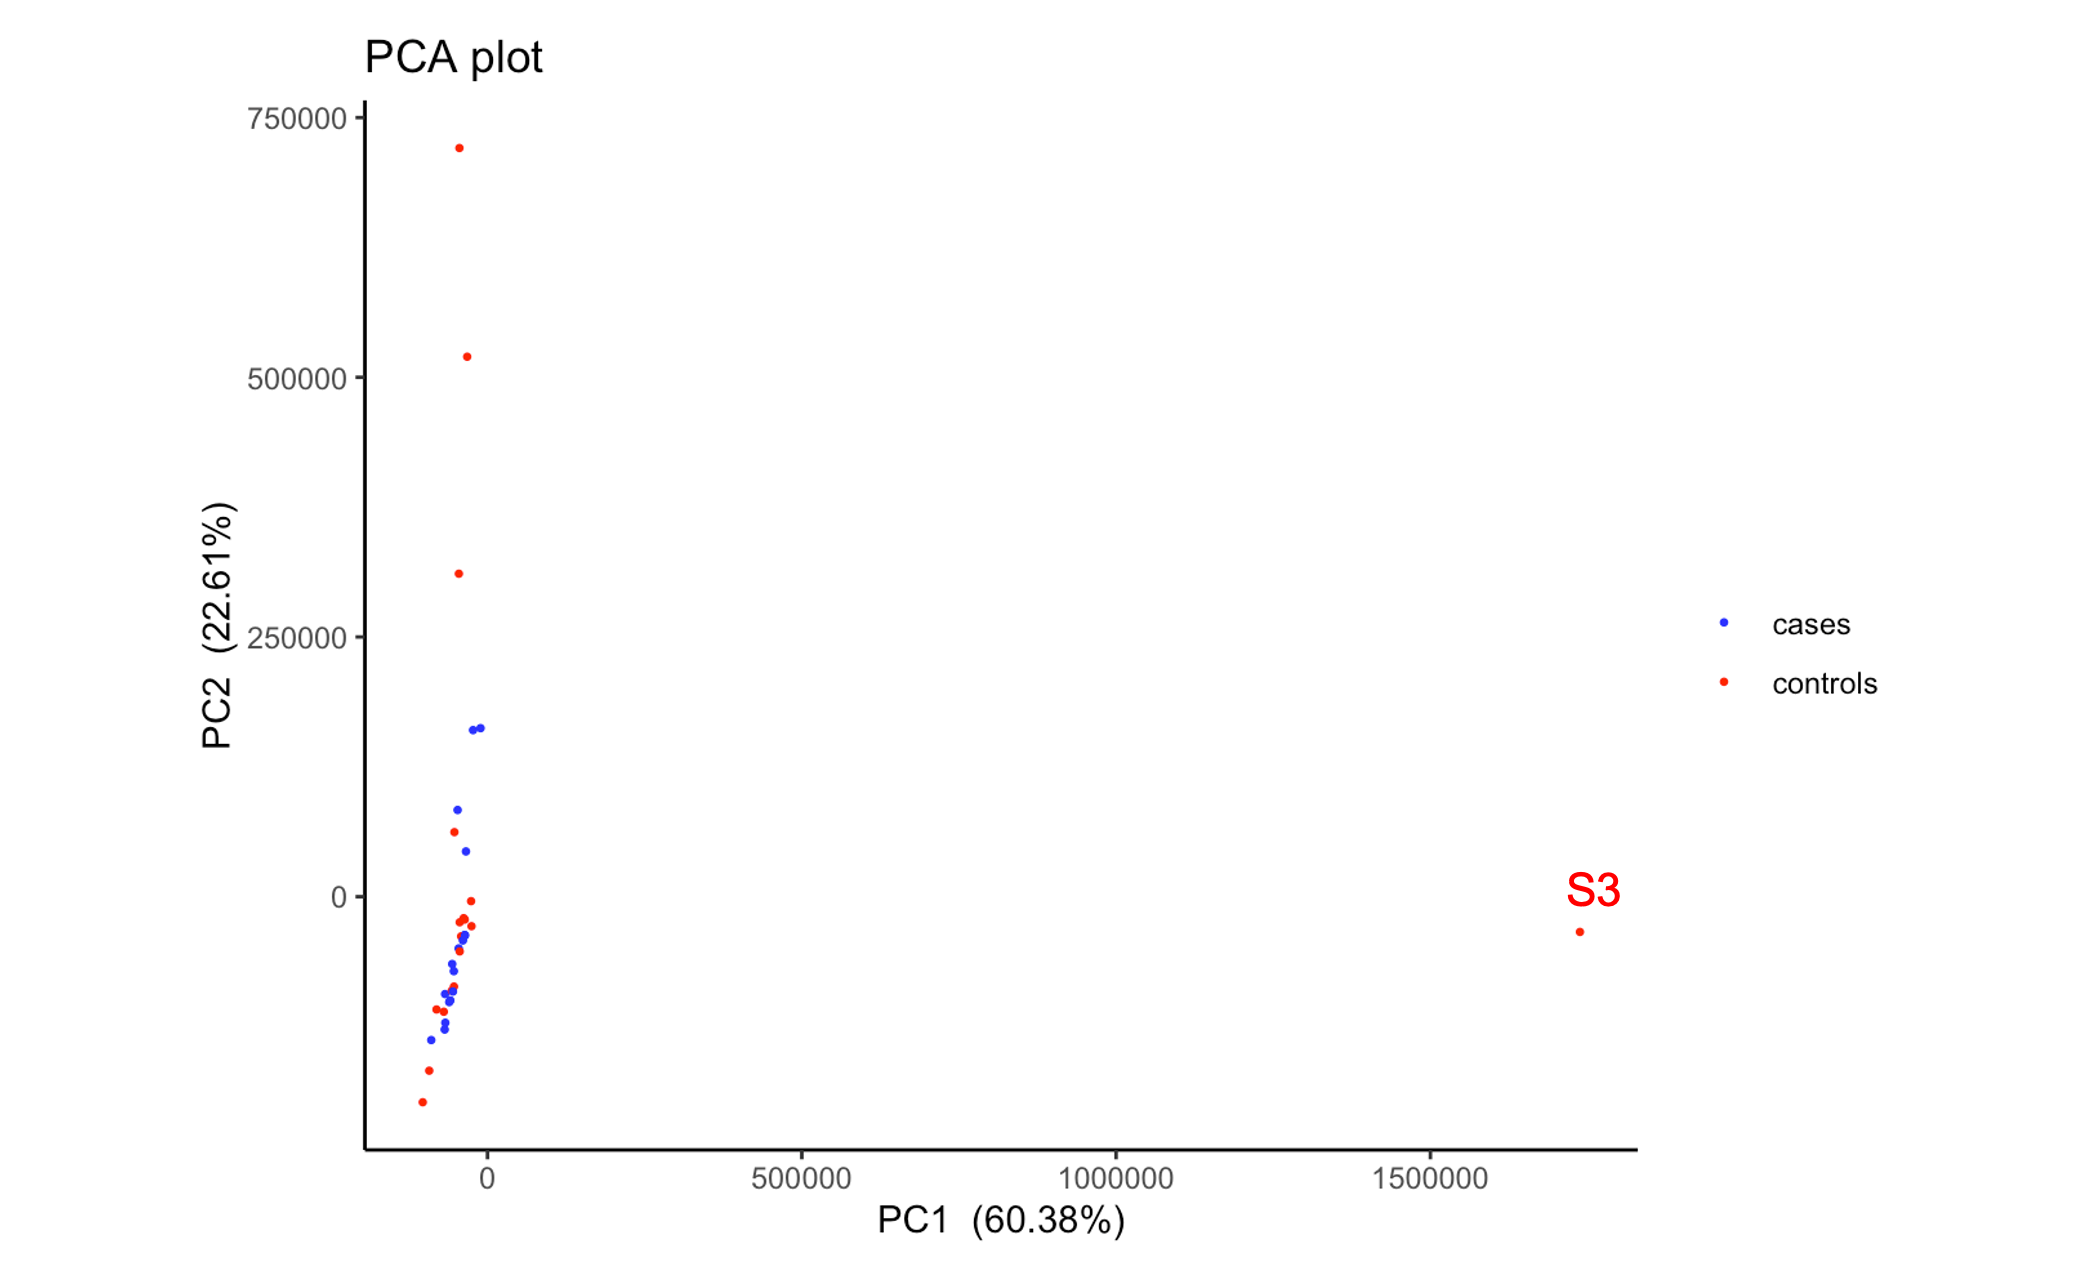
As of note, if I run a PCA on the normalised (untransformed) expression matrix from DESeq2, S3 is a very clear outlier
Thank you so much.

What both plots show is that there is notable separation along PC1 irrespective of group. That would be the main source of unwanted variation I would tackle, and not that one single outlier. You can use something like RUVseq (see vignette and the DESeq2 workflow at Bioconductor) to estimate factors of unwanted variation and include that into the design.
Thanks I will look into this