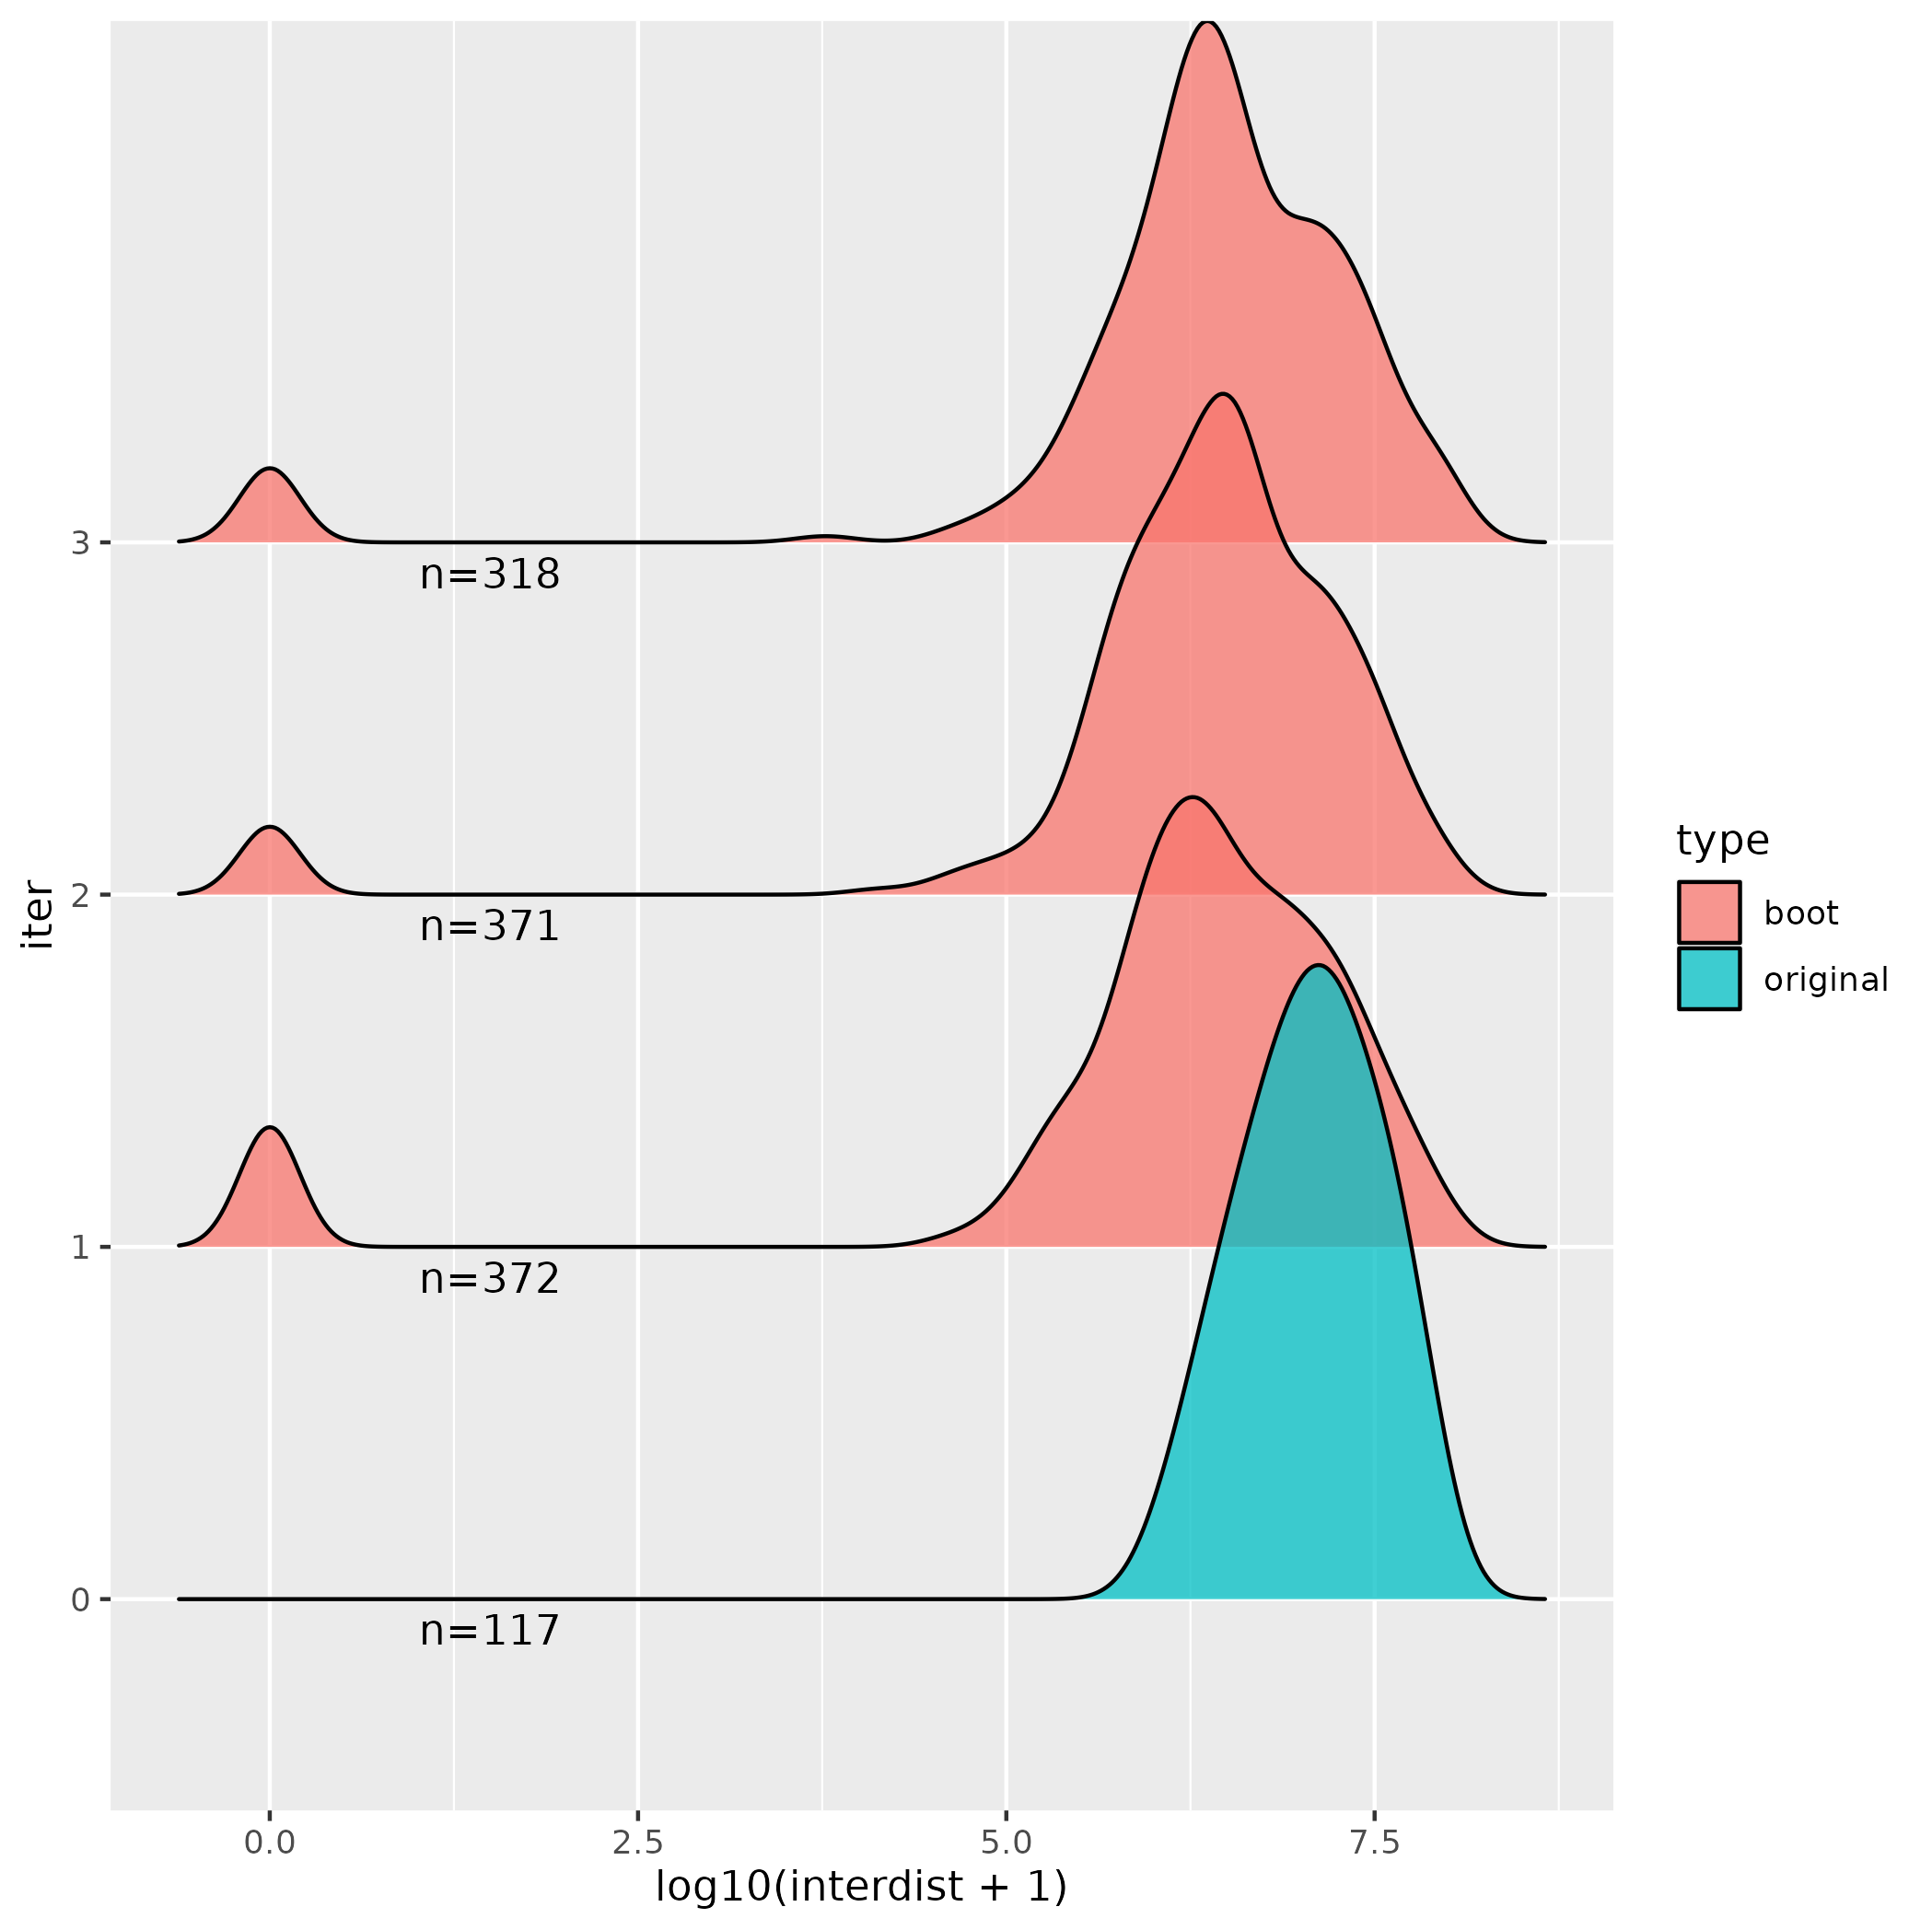
I am using the block bootstrapping functionality from the nullranges package in order to determine the significance of the overlap between genomic regions undergoing selection (n=117) and genes encoding a particular class of protein (n=394).
> table(seqnames(lassi))

 chr1  chr2  chr3  chr4  chr5  chr6  chr7  chr8  chr9 chr10 chr11 chr12 chr13
   10    14     7     5     3     3     4     4     7     2     7     5    10
chr14 chr15 chr16 chr17 chr18 chr19 chr20 chr21 chr22
    6     5     3     5     6     1     3     3     4
> summary(width(lassi))
   Min. 1st Qu.  Median    Mean 3rd Qu.    Max.
   5922  101154  175522  301892  272527 4351131
I have followed the example which looks at DNase hypersensitivity sites (DHS) here and tried to adapt the code to my own case. Using the example data, the result of the line:
stats = combined %>%
  group_by(iter) %>%
  summarize(n = n()) %>%
  as_tibble()
head(stats)
is:
## # A tibble: 6 × 2
##   iter      n
##   <fct> <int>
## 1 0      6214
## 2 1      6144
## 3 2      6265
## 4 3      6233
## 5 4      6291
## 6 5      6357
Which I assume is to make sure the number of ranges in each of the bootstraps is the same as in dhs?
When I exactly the same on my data, i.e. changing dhs to a GenomicRanges object of my regions of selection, the result of head(stats) is:
> head(stats)
# A tibble: 6 × 2
  iter      n
  <fct> <int>
1 0       117
2 1       372
3 2       371
4 3       318
5 4       343
6 5       316
and the first 3 iterations look like this, which seems like something has gone wrong. Is there a parameter that I am supposed to change to make the number of ranges in the bootstrap the same as in my target set of sequences (n=117) and is that the reason for the figure looking different (i.e. with the small peaks at zero in the bootstraps).


Thanks, I've edited my question - it does seem like there is quite a large variance in the size of the selection regions.
We have performed block bootstrapping on peaks, SNPs, etc. where the features tend to be either ~200-1000 bp or 1 bp for the latter. These features make sense with respect to sampling of blocks of size 500kb. But your features include one that is 4 Mb, which is larger than the block sizes we show in the vignette.
What is the question here? Whether the genes are close to the selection regions? Do you want to compute distance by TSS or the gene body? I'm thinking it would be easier to bootstrap the genes instead of the regions.
Thanks, that makes sense. Yeah the question is whether or not a particular classes of genes are enriched for regions of selection (and thus likely to be under selection). I guess we are interested in the TSS as well, but we usually just added a generic window around the coordinates of the structural gene. I will try bootstrapping the genes. Otherwise, if I am bootstrapping the selection regions, is there any issue with just increasing the block size to e.g. 8Mb or something else >4Mb?
The problem with increasing the block size to accommodate the large selection regions is that, the idea of the blocks is to capture e.g. structure at the level of isochores. These are around 300kb - 1MB:
from https://www.ncbi.nlm.nih.gov/pmc/articles/PMC1457033/
Gene density follows the isochore pattern to some degree. I would recommend boostrapping the genes then. You can bootstrap the entire gene region if you want, e.g. what you get with
genes().What do you mean by "generic window"?
Note that you can specify
maxgapwhen you do ajoin_overlap_*in plyranges, followingbootRanges.