Hi everyone,
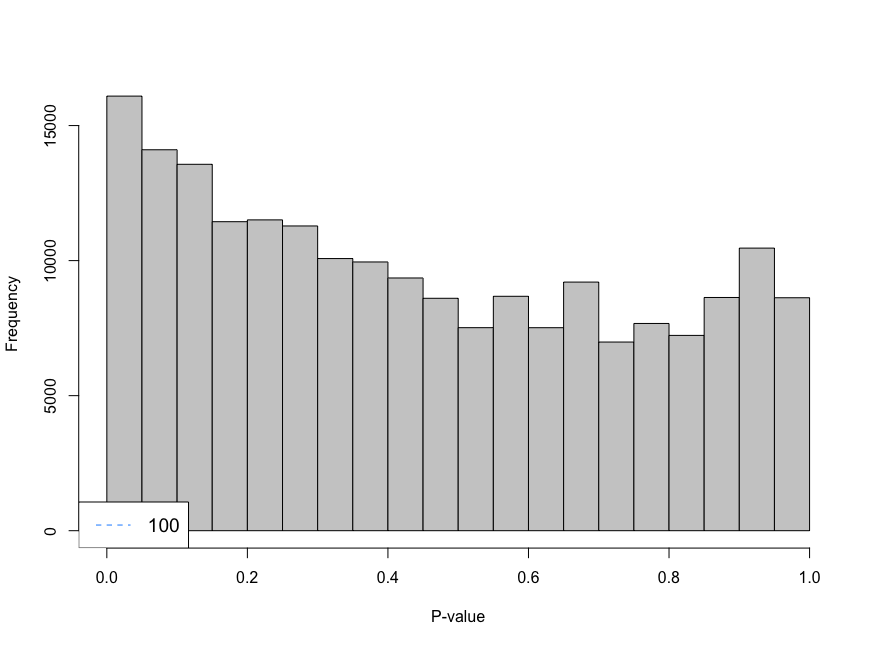
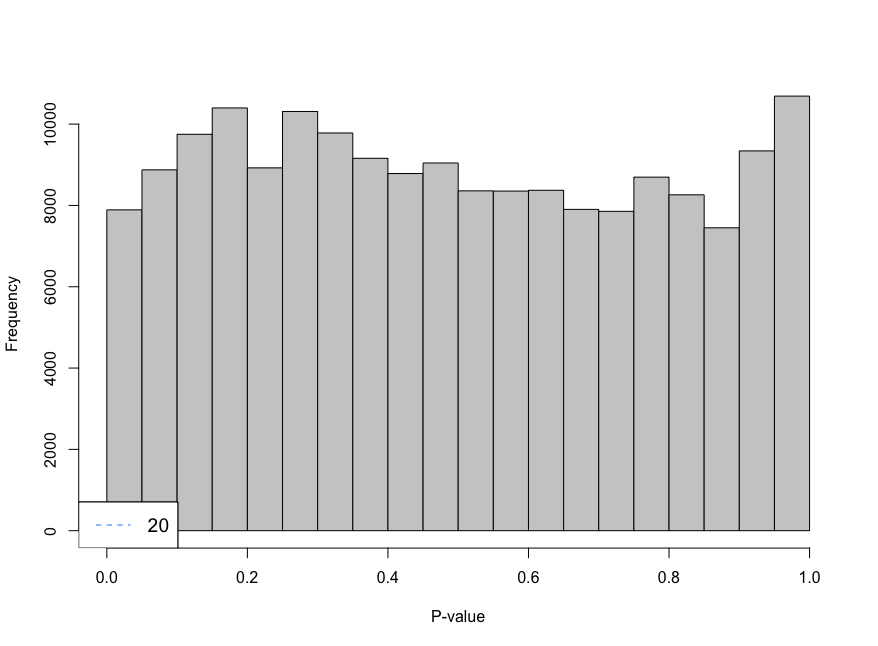
I am trying to analyse single cell data using CellRanger unfiltered data and I am using emptyDrops to remove droplets that contain ambient RNA. When using the parameter lower I am using 100 as the limit, however, the histogram shows large peaks near cero. I have decreased the parameter lower from 100 to 20 and look at the histogram. The histogram gives an "even" distribution at 20. I am not sure if that is a too low value to use as limit.
-Is decreasing the limit a sensible choice? -Not sure, if I fully understand the effect of setting a limit for this function -Is there any function to measure the lower limit?
Code should be placed in three backticks as shown below
limit <- 20
e.out_sample_1 <- emptyDrops(counts(sample_1), lower=limit, test.ambient=TRUE, BPPARAM = bp.params)
hist(e.out_sample_1$PValue[e.out_sample_1$Total <= limit & e.out_sample_1$Total > 0],
     xlab="P-value", main="", col="grey80")
legend("bottomleft", legend=limit,
       col="dodgerblue", lty=2, cex=1.2)

sessionInfo( )
R version 4.2.2 (2022-10-31)
Platform: aarch64-apple-darwin20 (64-bit)
Running under: macOS Ventura 13.3.1

Matrix products: default
LAPACK: /Library/Frameworks/R.framework/Versions/4.2-arm64/Resources/lib/libRlapack.dylib

locale:
[1] en_US.UTF-8/en_US.UTF-8/en_US.UTF-8/C/en_US.UTF-8/en_US.UTF-8

attached base packages:
[1] grid      stats4    stats     graphics  grDevices utils     datasets  methods   base

other attached packages:
 [1] lubridate_1.9.2             forcats_1.0.0               stringr_1.5.0
 [4] dplyr_1.1.2                 purrr_1.0.1                 readr_2.1.4
 [7] tidyr_1.3.0                 tibble_3.2.1                tidyverse_2.0.0
[10] UpSetR_1.4.0                cowplot_1.1.1               BiocParallel_1.32.6
[13] scater_1.26.1               ggplot2_3.4.2               scuttle_1.8.4
[16] DropletUtils_1.18.1         SingleCellExperiment_1.20.1 SummarizedExperiment_1.28.0
[19] Biobase_2.58.0              GenomicRanges_1.50.2        GenomeInfoDb_1.34.9
[22] IRanges_2.32.0              S4Vectors_0.36.2            BiocGenerics_0.44.0
[25] MatrixGenerics_1.10.0       matrixStats_0.63.0

loaded via a namespace (and not attached):
 [1] bitops_1.0-7              bit64_4.0.5               httr_1.4.5
 [4] tools_4.2.2               utf8_1.2.3                R6_2.5.1
 [7] irlba_2.3.5.1             HDF5Array_1.26.0          vipor_0.4.5
[10] DBI_1.1.3                 colorspace_2.1-0          rhdf5filters_1.10.1
[13] withr_2.5.0               tidyselect_1.2.0          gridExtra_2.3
[16] bit_4.0.5                 compiler_4.2.2            cli_3.6.1
[19] BiocNeighbors_1.16.0      DelayedArray_0.24.0       scales_1.2.1
[22] R.utils_2.12.2            XVector_0.38.0            pkgconfig_2.0.3
[25] sparseMatrixStats_1.10.0  fastmap_1.1.1             limma_3.54.2
[28] rlang_1.1.0               rstudioapi_0.14           RSQLite_2.3.1
[31] DelayedMatrixStats_1.20.0 generics_0.1.3            R.oo_1.25.0
[34] RCurl_1.98-1.12           magrittr_2.0.3            BiocSingular_1.14.0
[37] GenomeInfoDbData_1.2.9    Matrix_1.5-4              Rcpp_1.0.10
[40] ggbeeswarm_0.7.1          munsell_0.5.0             Rhdf5lib_1.20.0
[43] fansi_1.0.4               viridis_0.6.2             lifecycle_1.0.3
[46] R.methodsS3_1.8.2         stringi_1.7.12            edgeR_3.40.2
[49] zlibbioc_1.44.0           rhdf5_2.42.1              plyr_1.8.8
[52] blob_1.2.4                parallel_4.2.2            ggrepel_0.9.3
[55] dqrng_0.3.0               crayon_1.5.2              lattice_0.21-8
[58] Biostrings_2.66.0         beachmat_2.14.2           hms_1.1.3
[61] KEGGREST_1.38.0           locfit_1.5-9.7            metapod_1.6.0
[64] pillar_1.9.0              igraph_1.4.2              codetools_0.2-19
[67] ScaledMatrix_1.6.0        glue_1.6.2                scran_1.26.2
[70] remotes_2.4.2             BiocManager_1.30.20       png_0.1-8
[73] vctrs_0.6.2               tzdb_0.3.0                gtable_0.3.3
[76] cachem_1.0.7              rsvd_1.0.5                viridisLite_0.4.1
[79] AnnotationDbi_1.60.2      beeswarm_0.4.0            memoise_2.0.1
[82] cluster_2.1.4             statmod_1.5.0             bluster_1.8.0
[85] timechange_0.2.0
Thanks!!


