Entering edit mode

Hi! I am doing ggmaplot with res data from DESeq2. I really do not understand why the fc=2 but in the figure the threshold (gray line) is clearly not 2 and -2, but looks like 1 and -1. Can someone help me figuring this out?
library(ggpubr)
ggmaplot(res,
         fdr = 0.05, fc = 2, size = 0.4,
         palette = c("#B31B21", "#1465AC", "darkgray"),

         legend = "top", top = 0,
         font.label = c("bold", 11),
         font.legend = "bold",
         font.main = "bold",
         ggtheme = ggplot2::theme_minimal())
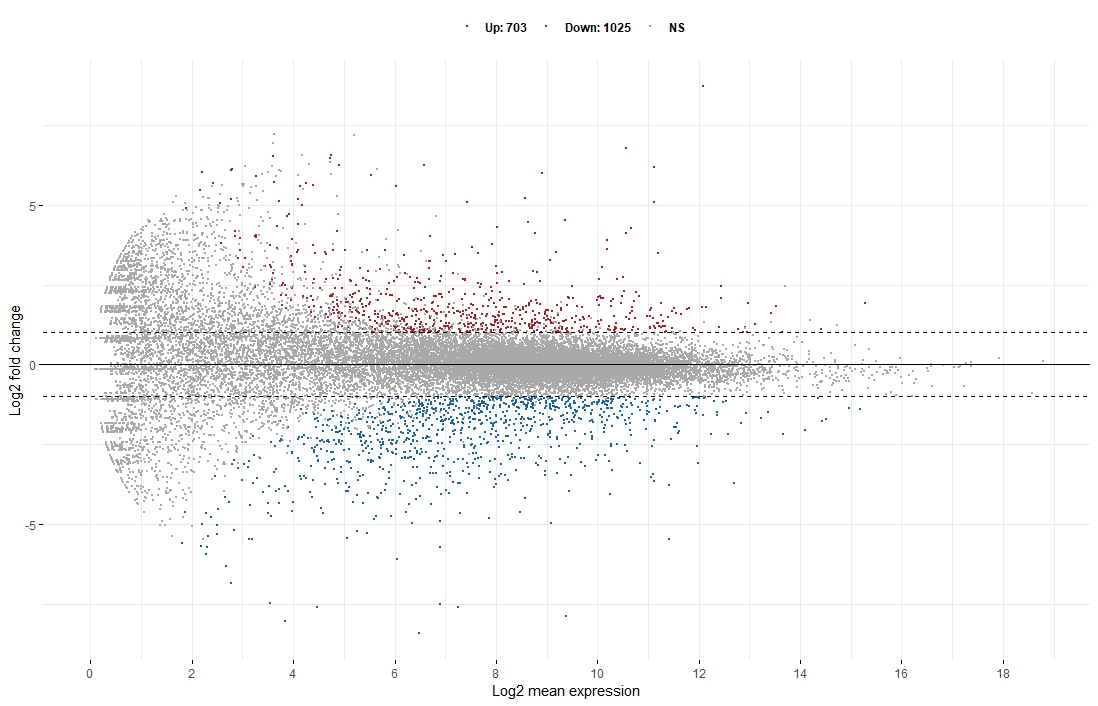

Oh god, thank you. So my data values are already LFC while this fc has still to be normalized by log2. I noticed that LFC=1 is generally kept as threshold in this kind of plot, wouldn't be LFC=2 more accurate, since genes with LFC ≥ 2 are considered DE?
How you set thresholds and do your plots is entirely on you.