Hello all,
Seem there is something wrong with my samples
samples <- read.csv("samplesheet_DiffBind.csv")
result <- dba.analyze(samples)
Error in peaks[, pCol]/max(peaks[, pCol]) : non-numeric argument to binary operator
I understand what this error means but don't know what is the cause. Would you suggest to me how to fix this? Thank you so much!


Thanks Rory!
Would you suggest how to fix this?
Apologies. The first line should be
I've gone back and edited previous replies to reflect this.
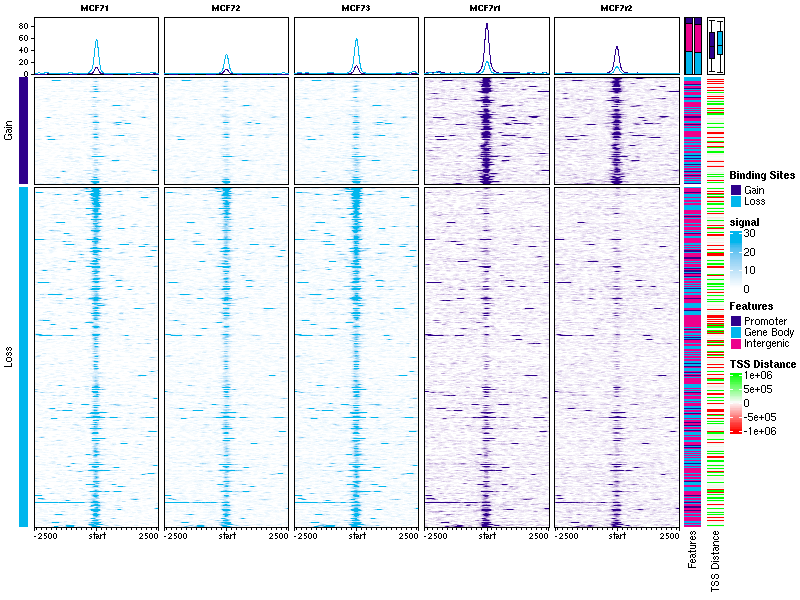
Thank you for your help! Would you tell me how can get a plot like this
There's a function in
DiffBindcalleddba.plotProfile()that generates these plots. However the annotations on the right hand side, showing overlaps with genomic features and distances to the nearest TSS, are not available in the current functionality.There's a tutorial notebook available showing how to get these plots, which you can see here: https://content.cruk.cam.ac.uk/bioinformatics/software/DiffBind/plotProfileDemo.html
Thanks Rory! Would you please tell me how to get annotate genes from results of DiffBind? I looked at the GenomicAlignments package but don't know how.