I came across this new "Mass Spectrometry Downstream Analysis Pipeline (MS-DAP)" R package. It uses 'ProtGenerics', 'MSnbase', 'limma' Bioconductor packages. https://github.com/ftwkoopmans/msdap
In its example, contrast is calculating as
dataset = setup_contrasts(dataset, contrast_list = list( c("WT","KO") ) )
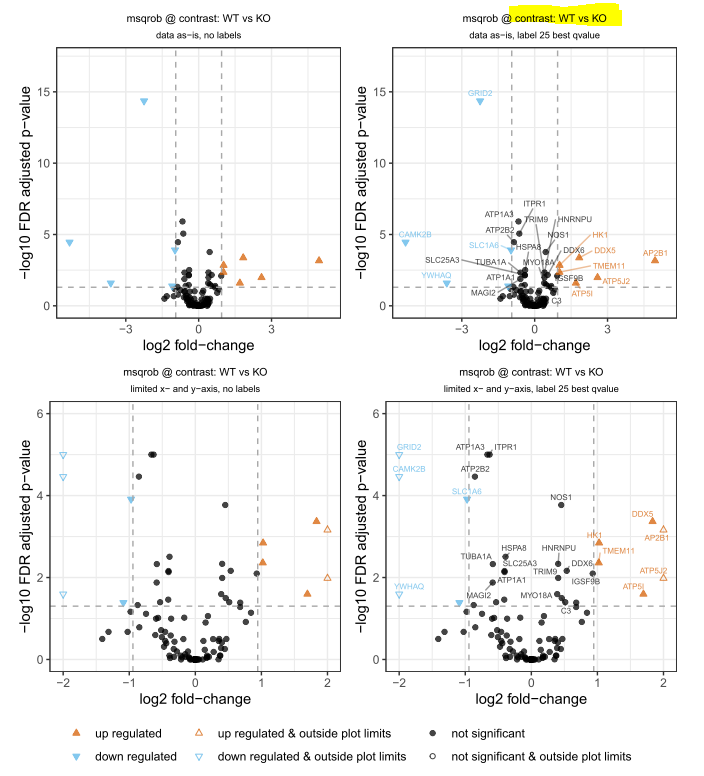
And its output looks like
When this graph title says "vs" in what context its been used? When we say A vs B; generally, we assume A ÷ B
Here in this volcano plot contrast: WT vs KO, do you mean to say your reference is KO or vice versa (i.e WT)? Are these red-color triangles (proteins) more abundant in WT or KO?
Can you help me to understand how this calculation function works please.


Thanks Prof. I asked, but no reply yet. If this is Limma, what would be the answer when we say WT vs KO; is that WT ÷ KO or vice versa?
I see "vs" is been used interchangeably in figure legends and if there are no specific labels on the figure, it's hard to understand.
e.g. https://www.nature.com/articles/s41598-021-82533-5 https://journals.plos.org/plosone/article/figure?id=10.1371/journal.pone.0063825.g003 https://www.sciencedirect.com/science/article/pii/S2352340922003092#! https://www.pnas.org/doi/10.1073/pnas.1720447115 https://www.htgmolecular.com/blog/2022-08-25/understanding-volcano-plots
In the limma documentation, and in my published papers, WT vs KO always means
WT - KOwhere WT and KO represent mean values on the log-scale. A protein with a positive logFC for WT vs KO is higher in WT.